I was looking for a new tool for easily visualizing git branches and workflows to try and visually show how Gerrit works (in terms of git basics) to clear up some confusions. I spent a short while reading stackoverflow, although most of the suggestions weren’t really any good as I didn’t want to visualize a real repository, but a fake set of hypothetical branches and commits.
I was suggested Graphviz by a friend, and quickly found webgraphviz.com which was going in the right direction, but this would require me to learn how to write DOT graph files.
Eventually I found gitgraph.js, which is a small JavaScript library for visualizing branching ‘things’, such as git, well, mainly git, hence the name and produce graphics such as the one below.

In order to rapidly prototype with gitgraph I setup a blueprint codepen.io pen with the following HTML …
<html>
  <head>
    <link rel="stylesheet" href="https://cdnjs.cloudflare.com/ajax/libs/gitgraph.js/1.11.4/gitgraph.css" />
    <script src="https://cdnjs.cloudflare.com/ajax/libs/gitgraph.js/1.11.4/gitgraph.min.js"></script>
  </head>
  <body><canvas id="graph"></canvas></body>
</html>
… and following JS …
var graph = new GitGraph({
  template: "metro", // or blackarrow
  orientation: "vertical",
  elementId: 'graph',
  mode: "extended", // or compact if you don't want the messages
});

var master = graph.branch("master");
master.commit( { message: "Initial Commit" });
… to render the rather simple single commit branch below …

Styling can be adjusted passing a template into the GitGraph object …
var myTemplateConfig = {
    colors: ["#008fb5", "#979797", "#f1c109", "#33cc33"],
          branch: {
            lineWidth: 3,
            spacingX: 30,
            labelRotation: 0
          },
  commit: {
        spacingY: 40,
        dot: {
          size: 10
        },
        message: {
          displayAuthor: false,
          displayBranch: true,
          displayHash: true,
          font: "normal 14pt Arial"
        }
    }

};
var myTemplate = new GitGraph.Template( myTemplateConfig );

var graph = new GitGraph({
  template: "metro", // or blackarrow
  orientation: "vertical",
  elementId: 'graph',
  mode: "extended", // or compact if you don't want the messages
  template: myTemplate
});
… which would render …

The blueprint codepen for this style can be found at https://codepen.io/addshore/pen/xWdZXQ.
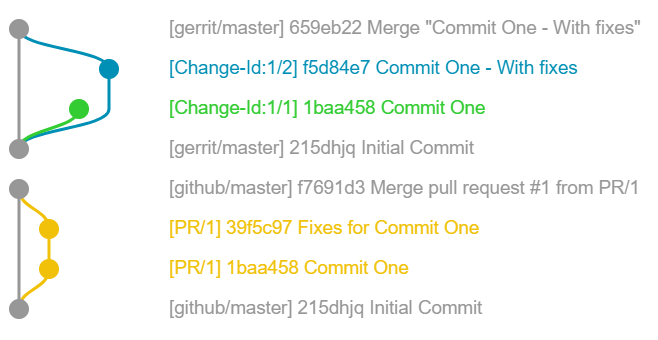
With this blueprint setup I now have a starting point for further visualizations using gitgraph and codepen comparing Gerrit and Github, for example below comparing a merged pull request consisting of two commits, the second of which contains fixes for the first, vs a single change in gerrit, that has 2 seperate versions.
Keep an eye out on this blog for any more progress I make with this.
I really like gitgraph.js, in fact it’s what I used to produce the graph on https://phabricator.wikimedia.org/T89945