It’s time for the first 2018 installation of the Wikidata Map. It has been roughly 4 months since the last post, which compared July 2017 to November 2017. Here we will compare November 2017 to March 2018. For anyone new to this series of posts you can check back at the progression of these maps by looking at the posts on the series page.
Each Wikidata Item with a Coordinate Location(P625)will have a single pixel dot. The more Items present, the more pixel dots and the more the map will glow in that area. The pixel dots are plotted on a totally black canvas, so any land mass outline simply comes from the mass of dots. You can find the raw data for these maps and all historical maps on Wikimedia Tool Labs.
Looking at the two maps below (the more recent map being on the right) it is hard to see the differences by eye, which is why I’ll use ImageMagik to generate a comparison image. Previous comparisons have used Resemble.js.

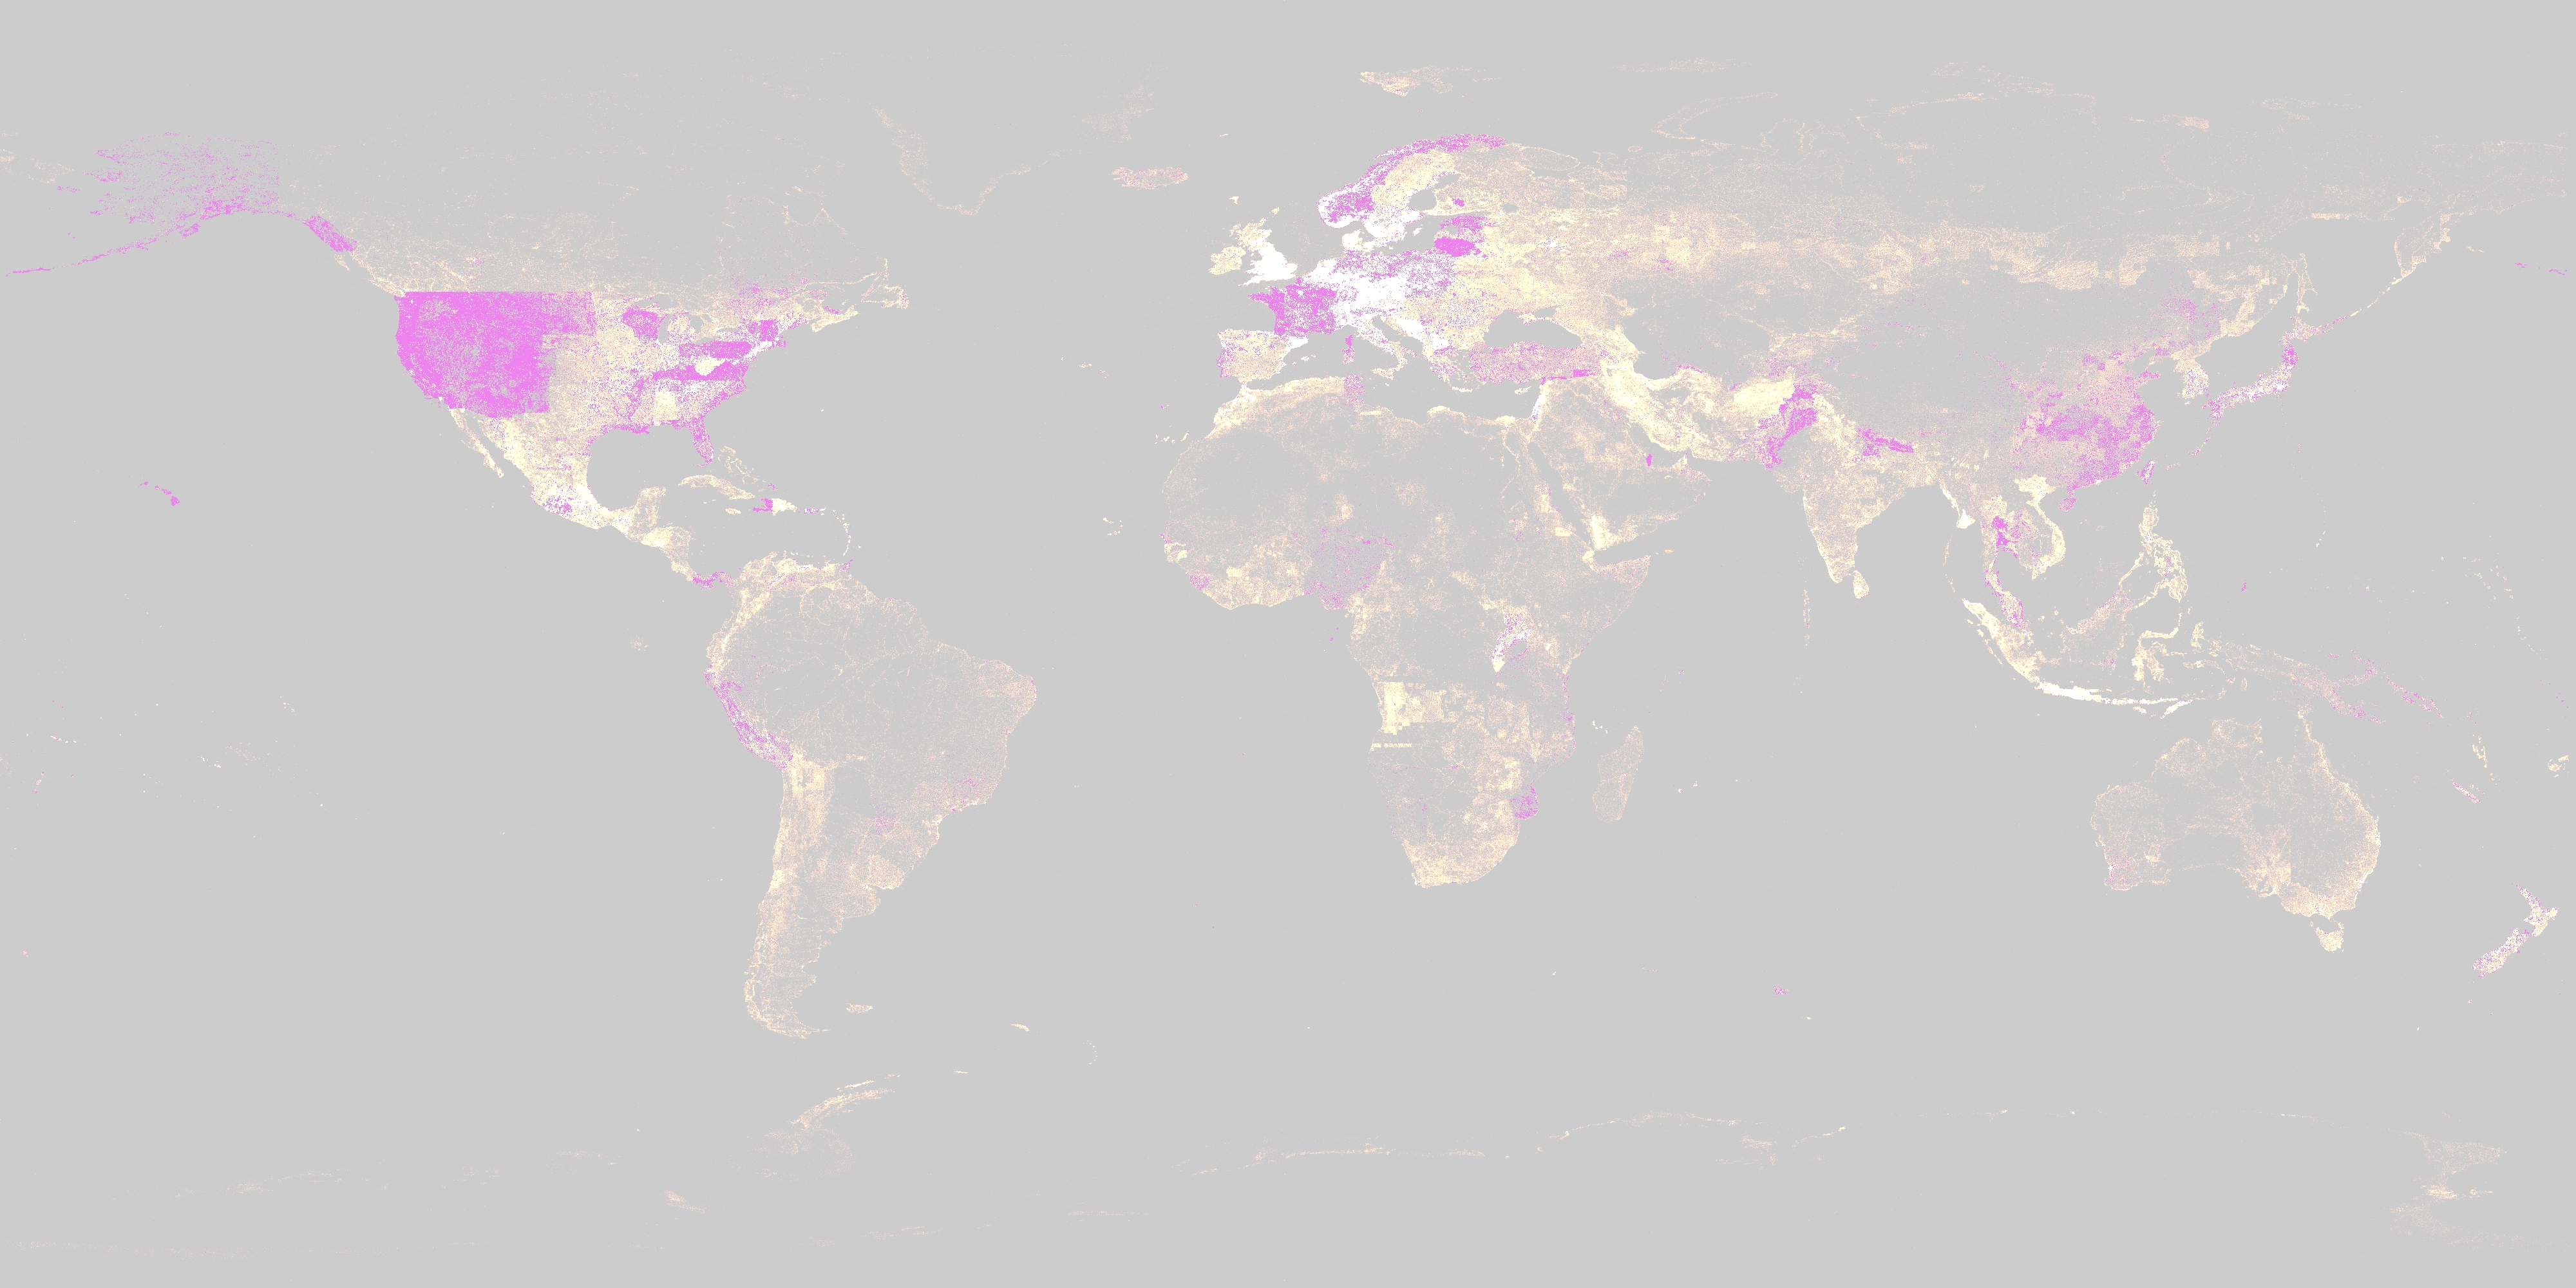
ImageMagik has a compare script that can highlight areas of change in another colour, and soften the unchanged areas of the image. The image below highlights the changed areas in violet while fading everything that remains unchanged between the two images. As a result all areas highlighted in violet have either had Items added or removed. These areas can then be compared with the originals to confirm that these areas are in fact additions.
If you want to try comparing two maps, or two other images, using ImageMagik then you can try out https://online-image-comparison.com/ which allows you to do this online!
What has changed?
The main areas of change that are visible on the diff are:
- Western US States
- North Eastern US States
- Alaska
- Hawaii
- Haiti
- France
- Norway
- Estonia
- Lithuania
- Pakistan
- Eastern China
- Northern Japan
- Thailand
There is a covering of violet across the entire map, but these are the key areas.
If you know the causes for these areas of greatest increase, or think I have missed something important, then leave a comment below and I’ll be sure to update this post with links to the projects and or users.
Files on Commons
All sizes of the Wikidata map for March have been uploaded to Wikimedia Commons.
- https://commons.wikimedia.org/wiki/File:Wikidata_Map_March_2018_Small.png
- https://commons.wikimedia.org/wiki/File:Wikidata_Map_March_2018_Normal.png
- https://commons.wikimedia.org/wiki/File:Wikidata_Map_March_2018_Big.png
- https://commons.wikimedia.org/wiki/File:Wikidata_Map_March_2018_Huge.png
- https://commons.wikimedia.org/wiki/File:Wikidata_Map_March_2018_Enourmous.png
- https://commons.wikimedia.org/wiki/File:Wikidata_items_map_with_difference,_November_2017_to_March_2018_(faded).png
How many points have been added, in the period in question?
That is a good question that I don’t know the answer to.
Between 20th Nov 2017 and 16th March 2018 the number of Items on Wikidata has increased from 38.81 million to 45.89 million, which is an increase of 7.08 million. This will however include items that do not have coordinates and also not include items that already existed that had coordinates added to them.
The data the maps come from can be found at https://tools.wmflabs.org/wikidata-analysis/20171120/ and https://tools.wmflabs.org/wikidata-analysis/20180326/ in the graph.json files.
A small grep and count shows that there were 11,705,431 “Q”s in the file in Nov 2017 and 12,287,763 “Q”s in the file from March 2018.
So it looks like there are 582,332 more points on the March map. This doesn’t necessarily add up to the number of added points as points may also have been removed in this time.
Thank you.
It’s been suggested (in Facebook’s “The Wikidata Community” group) that this project:
https://www.wikidata.org/wiki/Wikidata:WikiProject_France/Églises
might explain the high level of activity in France.