The title is a little wordy, but I hope you get the gist. I just spent 10 minutes staring at some data on a Grafana dashboard, comparing it with some other data, and finding the numbers didn’t add up. Here is the story in case it catches you out.
The dashboard
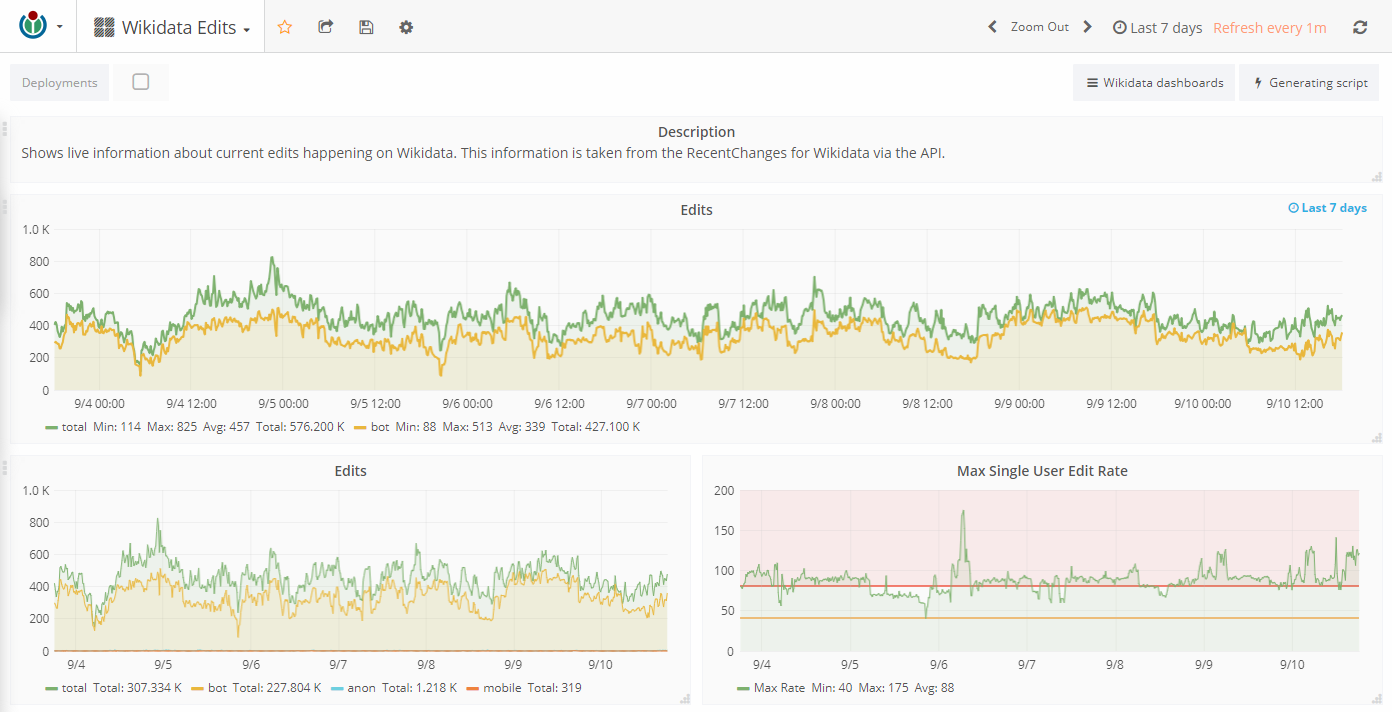
The dashboard in question is the Wikidata Edits dashboard hosted on the Wikimedia Grafana instance that is public for all to see. The top of the dashboard features a panel that shows the total number of edits on Wikidata in the past 7 days. The rest of the dashboard breaks these edits down further, including another general edits panel on the left of the second row.
The problem
The screenshot above shows that the top edit panel is fixed to show the last 7 days (this can be seen by looking at the blue text in the top right of the panel). The second edits panel on the left of the second row is also currently displaying data for the last 7 days (this can be seen by looking at the range selector on the top right of the dashboard.
The outlines of the 2 graphs in the panels appear to follow the same general shape. However both panels show different totals for the total edits made in the window. The first panel reports 576k edits in 1 week, but the second panel reports 307k. What on earth is going on?
Double checking the data against another source I found that both numbers here are totally off. For a single day the total edits is closer to 700k, which scales up to 4-5 million edits per week.
hive (event)> select count(*)
            > from mediawiki_revision_create
            > where `database` = "wikidatawiki"
            > and meta.dt between "2018-09-09T02:00Z" and "2018-09-10T02:00Z"
            > and year=2018 and month=9 and (day=9 or day=10)
            > ;
.....
_c0
702453
Time taken: 24.991 seconds, Fetched: 1 row(s)Code language: JavaScript (javascript)
maxDataPoints
The Graphite render API used by Grafana has a parameter called maxDataPoints which decides the total number of data points to return. The docs are slightly more detailed saying:
Set the maximum numbers of datapoints for each series returned when using json content.
Graphite 1.14 docs
If for any output series the number of datapoints in a selected range exceeds the maxDataPoints value then the datapoints over the whole period are consolidated.
The function used to consolidate points can be set using the consolidateBy function.
Reading the documentation of the consolidateBy functions we find the problem:
The consolidateBy() function changes the consolidation function from the default of ‘average’ to one of ‘sum’, ‘max’, ‘min’, ‘first’, or ‘last’.
Graphite 1.14 docs
As the default consolidateBy function of ‘average’ is used, the total value on the dashboard will never be correct. Instead we will get the total of the averages.
Fixes for the dashboard
I could set the maxDataPoints parameter to 9999999 for all panels, that would mean that the previous assumptions would now hold true. Grafana would be getting ALL of the data points in Graphite and correctly totaling them. I gave it a quick shot but it probably isn’t what we want. We don’t need that level of granularity.
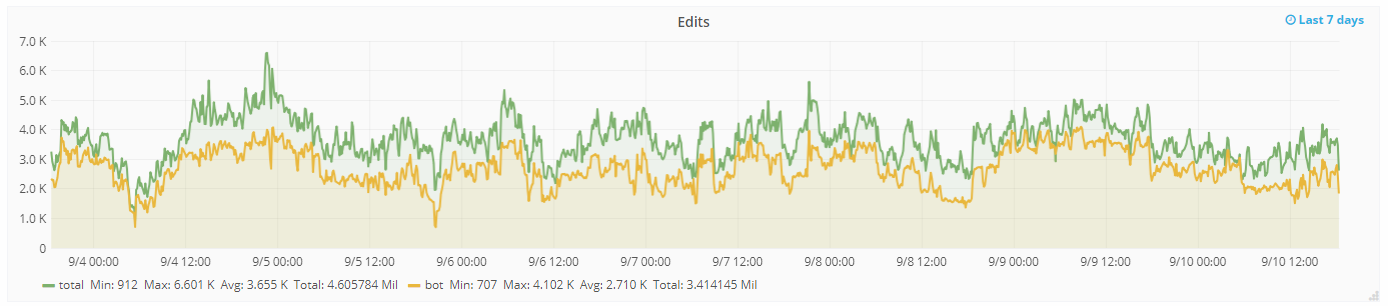
Adding consolidateBy(sum) should do the trick. And in the screenshot below we can now see that the totals make sense and roughly line up with our estimations.
For now I have actually set the second panel to have a maxDataPoints value for 9999999. As the data is stored at a minutely granularity this means roughly 19 years of minutely data can be accessed. When looking at the default of 7 days that equates to 143KB of data.

Continued confusion and misdirection

I have no doubt that Grafana will continue to trip me and others up with little quirks like this. At least the tooltip for the maxDataPoints options explains exactly what the option does, although this is hidden by default on the current Wikimedia version.
Data data everywhere. If only it were all correct.
Instead of 9999999, try setting max data points to -1.