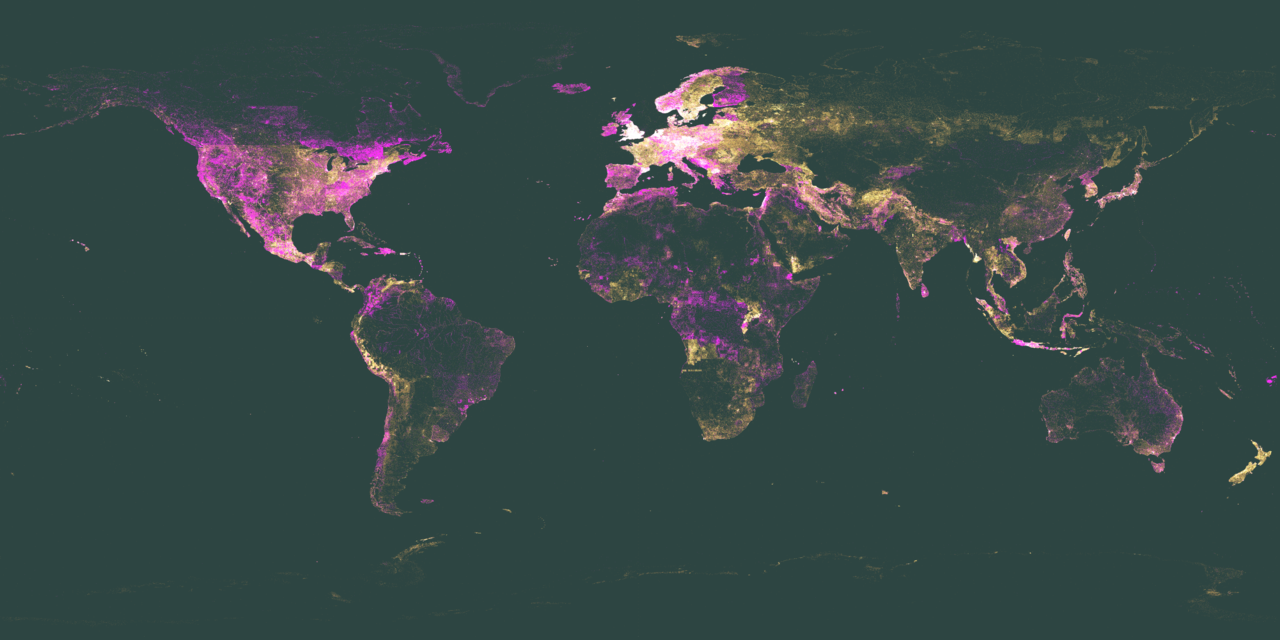
Wikidata Map October 2018
It has been another 6 months since my last post in the Wikidata Map series. In that time Wikidata has gained 4 million items, 1 property with the globe-coordinate data type (coordinates of geographic centre) and 1 million items with coordinates [1]. Each Wikidata item with a coordinate is represented on the map with a single dim pixel. Below you can see the areas of change between this new map and the once generated in March. To see the equivalent change in the previous 4 months take a look at the previous post.
Daniel Mietchen believes that lots of the increased coverage could probably be attributed to Cebuano Bot. (link needed).
Areas of increase
Below I have extracted sections of the map that have shown significant increase in items.
If you know why these areas saw an increase, such as a wikiproject or individual working on the area, then please leave a comment below and I’ll be sure to add explanations for each area.
If you think I have missed an area also please leave a comment and I’ll add that too!
Africa
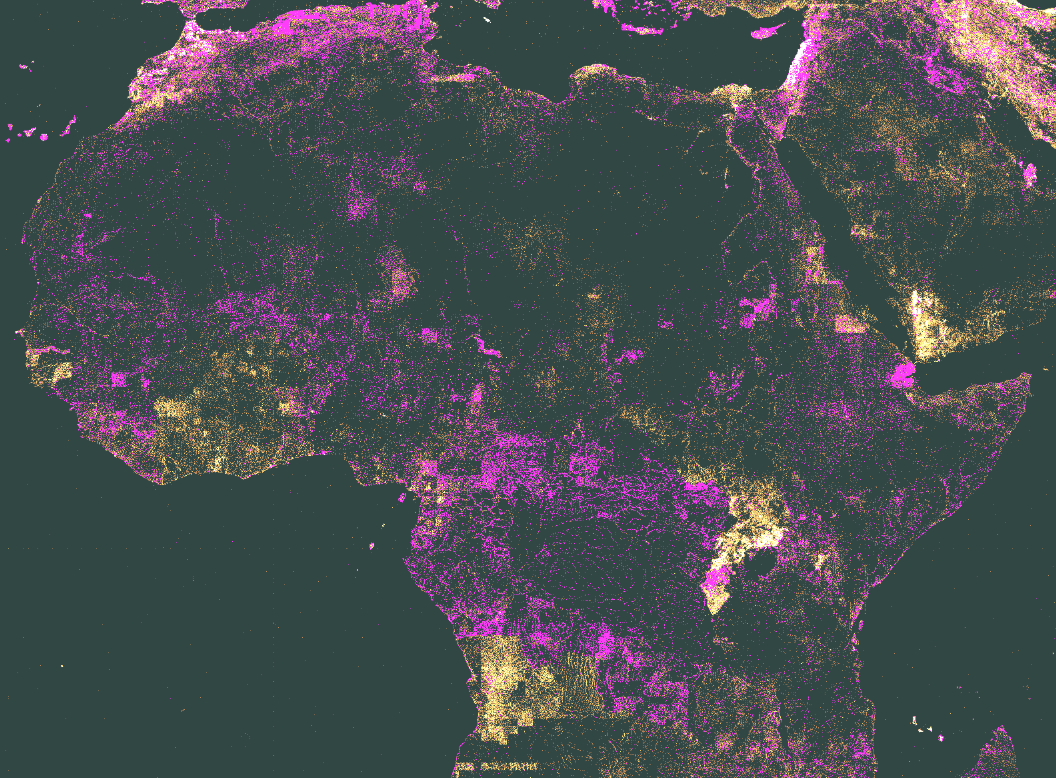
Some areas within Africa can be picked out as having specific increases:
- Republic of Cameroon
- Gabonese Republic
- Democratic Republic of the Congo
- People’s Democratic Republic of Algeria
- Republic of Djibouti
The increase in the coverage on the African continent in general by Wikidata could be down to Wikimania 2018 which was held in Cape Town. Cape Town itself doesn’t show any real increase in items in the 6 month period and is not included in the image above. Mexico also so an increase to the number of items in Wikidata in the area when Wikimania was hosted there in 2015.
Asia
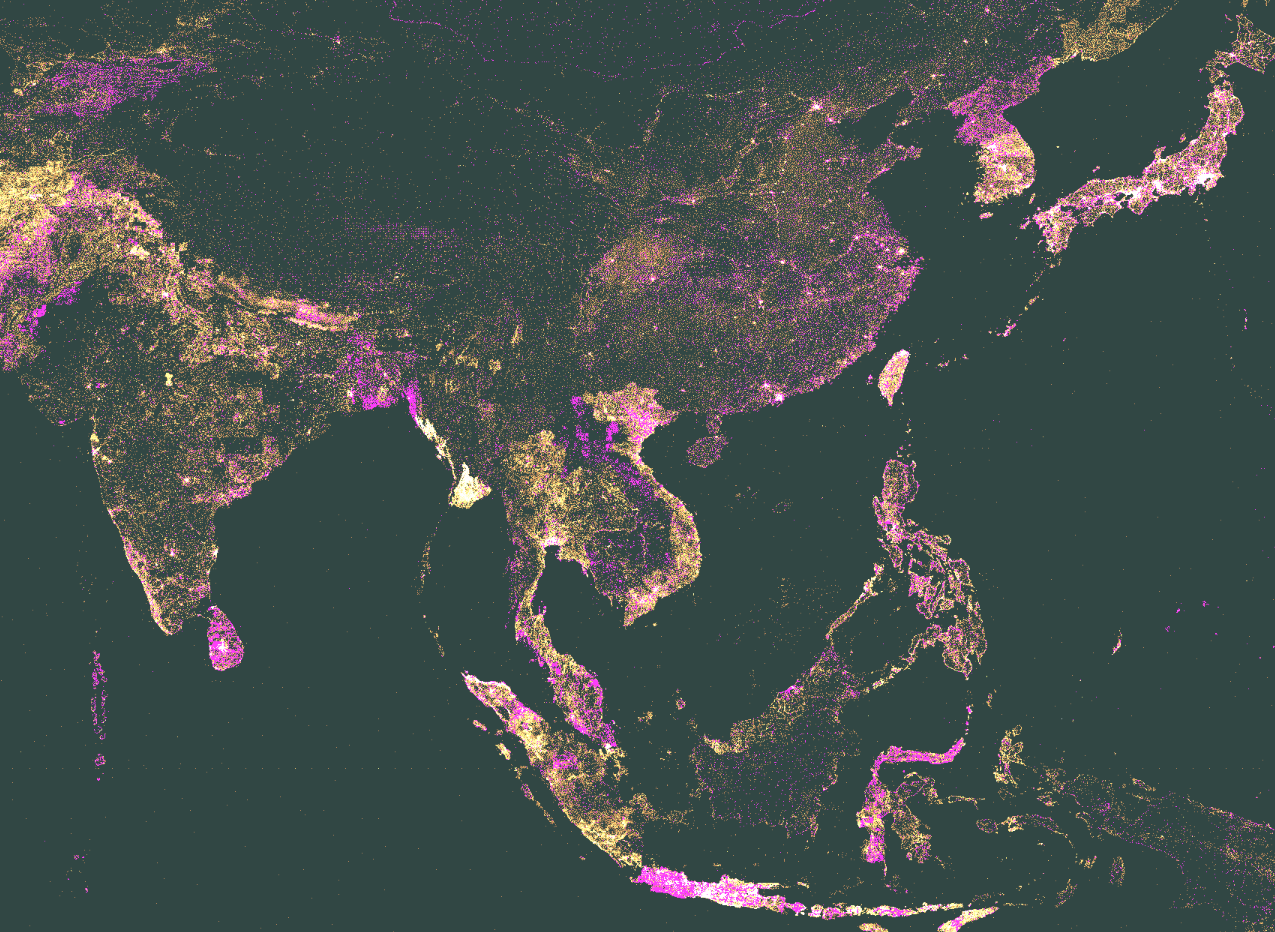
The main areas of increase here appear to be:
- Jakarta
- Indonesia
- Bangkok
- North Korea
Europe
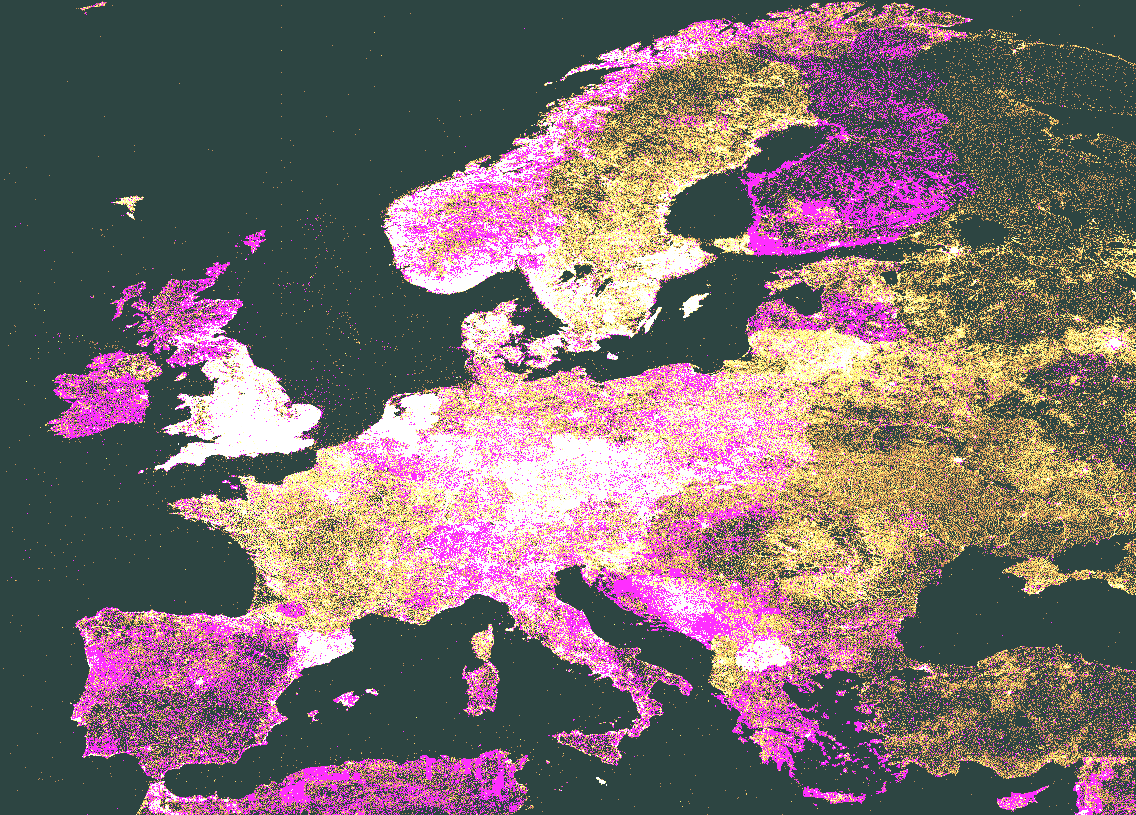
The main areas of increase here appear to be:
- Scotland
- Ireland
- Norway
- Finland
- Latvia
- Greece
- Croatia
- Cyprus (while not in europe) can be seen in the bottom right
North America
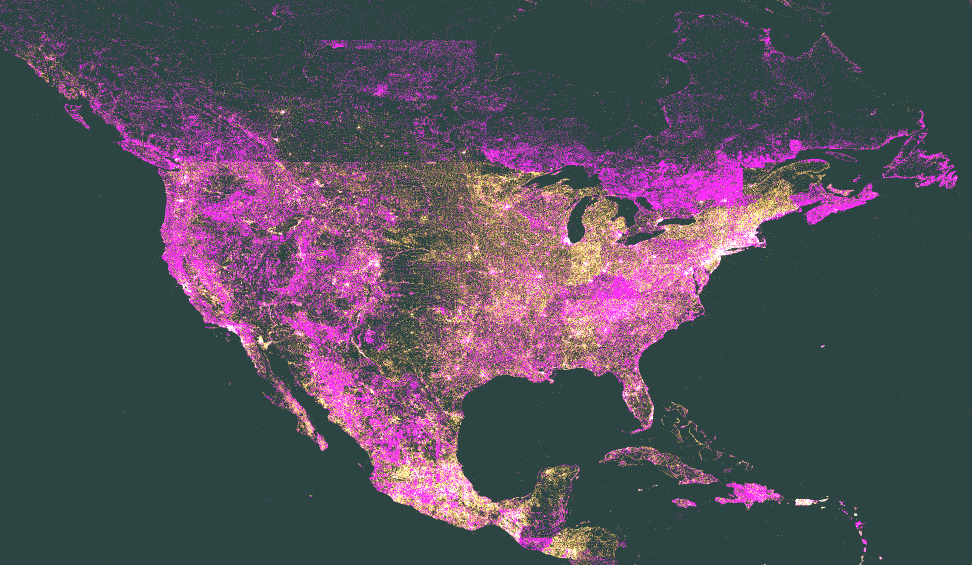
There is a general increase across the whole of North America. Most notably the west of continent and Canada.
The Dominican republic can also be seen in bright colour to the bottom right of the image.
South America
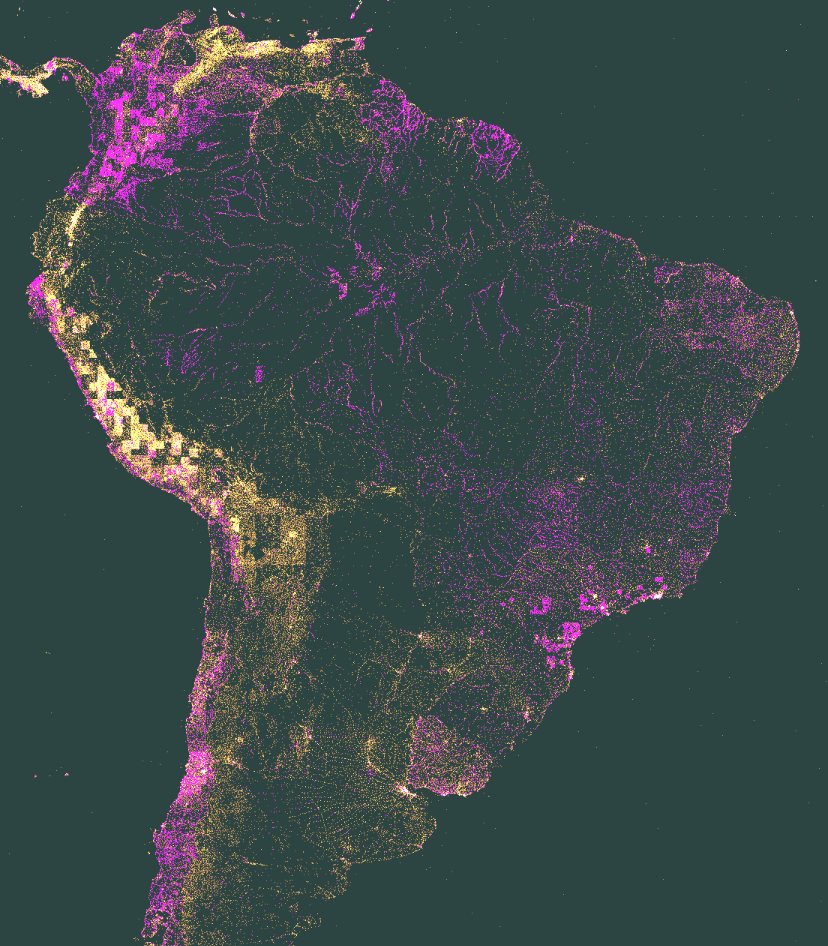
South America has a general increase throughout, however various areas appear highlighted such as:
- Columbia
- Chile
- São Paulo & Brazil
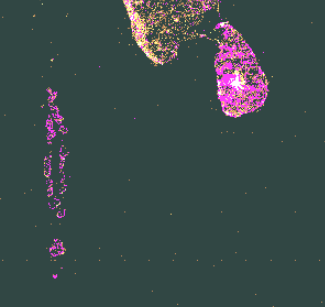
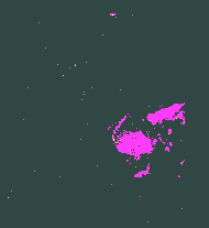
Smaller snippets
Iceland

Sri Lanka & Maldives
Fiji
Footnotes
[1] Number of items with coordinates based on grepping the generated wdlabel.json file used by the map generation.addshore@stat1005:~$ grep -o ",\"Q" wdlabel-20181001.json | wc -l
6765828
addshore@stat1005:~$ grep -o ",\"Q" wdlabel-20180326.json | wc -l
5764875Code language: JavaScript (javascript)Links
The October 2018 images: https://tools.wmflabs.org/wikidata-analysis/20181001/geo2png/
Hi. Do you know why Chile increased so much? Thanks in advance.
Not yet, but if I find out I’ll be sure to update this post!
In your analysis it absolutely hurts how you portray Africa as a country and you don’t even give time to the big regions like West Africa, while you later go into Fiji. The continent includes 54 states, various regions, official languages and infrastructural requirements for dealing with Wikidata. This seems to me personally to be very western-centric and derogatory for 1.3 billion people living on the African continent.
There is no intention of portraying Africa as a country, the post at this stage doesn’t say country at all, only referring to the clippings as areas.
I have made some changes to the port to try to reflect that. These include combining USA, Canada & Mexico (previously 2 areas), and also highlighting some of the African states that seem to show greater increase than the rest of the continent.
I wouldn’t really call the post analysis at this stage. I’m simply trying to highlight areas by eye that show increase to try to trigger others to think about why this has happened in the areas.
This map has had a habit of being “western” centric ever since the first version in 2012. Whenever I spot concentrated increase to an area I will try to highlight it, no matter where in the world it is. Eg. https://addshore.com/2016/05/wikidata-map-may-2016/
Many thanks for your efforts to follow up on this. Is there any chance to get the total number of geolocalised items (i.e. items with coordinates)? Many thanks
You can find this in the footnote at the bottom of the post.
For the October dump I found 6,765,828.
This only includes statements using P625 “coordinate location”.
I know there are a few other properties now, but this map has always only looked at that property.
I created https://phabricator.wikimedia.org/T206605 to discuss possibly including more statements on the map.
[…] private blog addshore.com published an article about the increase in the number of Wikidata items over the past 6 months. The article […]