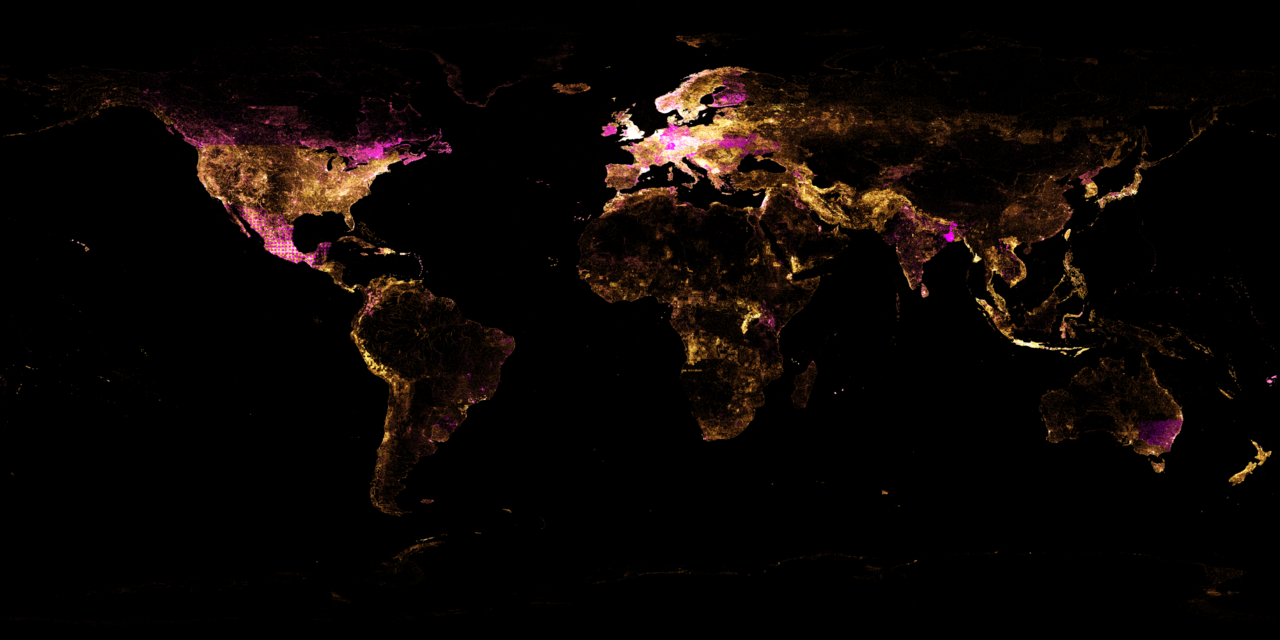
It’s been another 9 months since my last blog post covering the Wikidata generated geo location maps that I have been tending to for a few years now. Writing this from a hammock, lets see what has noticeably changed in the last 9 months using a visual diff and my pretty reasonable eyes.

Highlighting the changes
Rather than just doing a visual image diff I decided to also make a gif flicking between the two images to highlight changes in a new way.
I used https://ezgif.com to create this gif, simply uploading the two different images and downloading the result.

I also used https://rsmbl.github.io/Resemble.js/ to do the same visual diff that I have used in previous blog posts, highlighting areas of change in pink. The full size image is available on Commons.
Noticeable changes
The snippets below are not a comprehensive list of changed areas, just the places that I noticed with a quick gaze.
If I have missed somewhere please comment and I’ll be sure to update the post!
Ireland & Wales
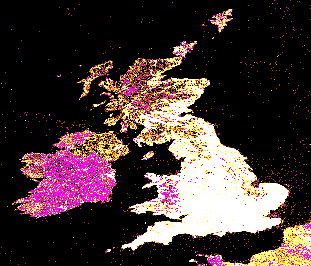
I’m from the UK, so the first thing that I notice is the increase in Wikidata Items in Ireland and Wales.
We also start to see an issue with the density sensitivity / density of the current map settings, as most of England is fully saturated and the map will no longer show us new additions here.
Central & Eastern Europe
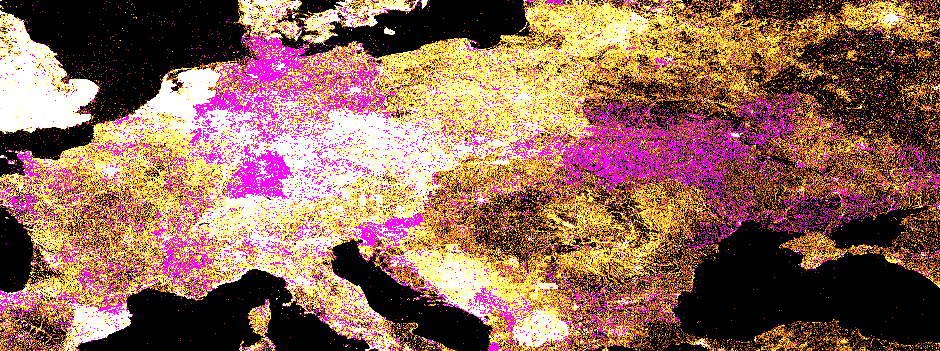
Europe in general sees scattered increases. Ukraine and Germany both stand out as having more significant increases within their boundaries.
Northern Europe
Finland sees increases in Northern Europe.
Kenya
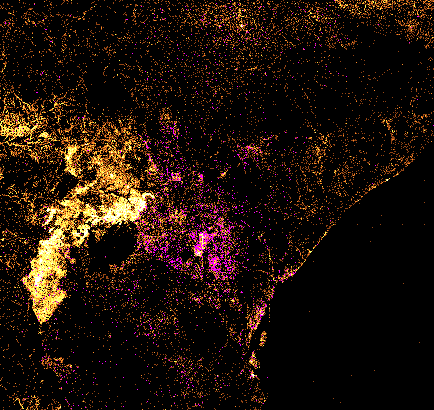
Not super defined, but Kenya has definitely seen an increase in Wikidata Items.
Australia
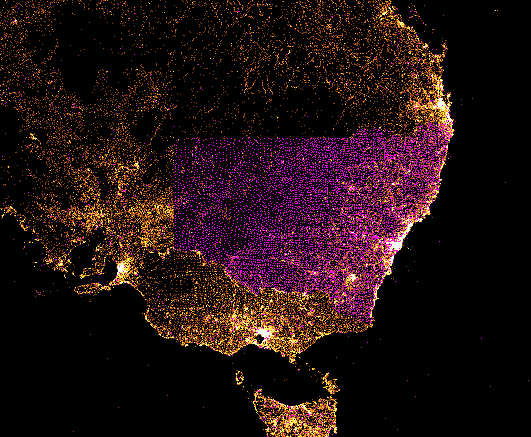
New south wales appears to have a fairly well defined increase in Wikidata Items.
India
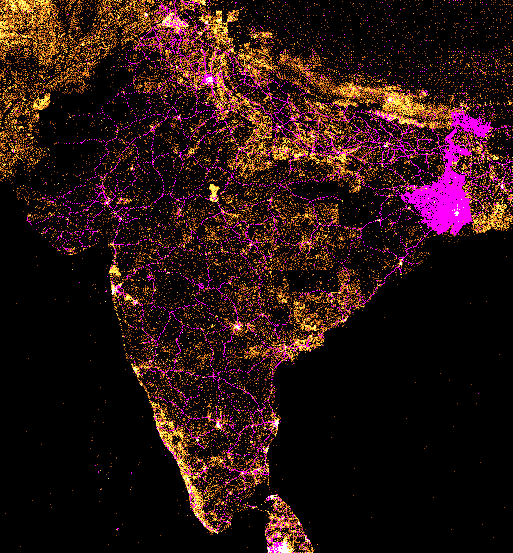
There has definitely been some new Wikidata Items or coordinates for what are probably road networks or rivers in India.
West Bengal also seems to have had a pretty well defined increase in Wikidata Items.
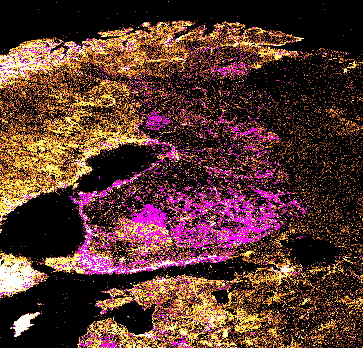
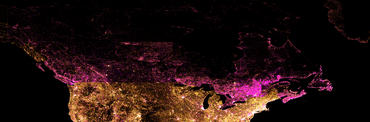
Mexico
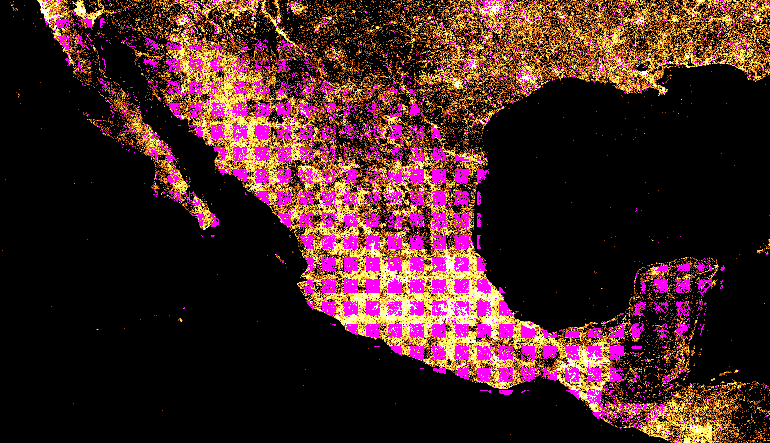
I really have no idea what is happening in Mexico. Odd blocks everywhere. If anyone has any ideas let me know! This could be an issue with the map generation?
Or as suggested on Twitter, this could be an issue with a mass import of data.
Canada
There has been a general increase across the whole of Canada, but no areas really jump out.
Future map thoughts
It’s becoming clear that as Wikidata continues to grow, this map is going to become more and more useless in its current state. Given infinite time it is just going to end up being a bright yellow / white map of the world, not able to show any areas of increase.
Perhaps the map generation needs to be altered to provide different intensity versions, so that we can continue to spot growth in highly populated areas such as England etc.
If anyone wants to get involved with the map code, or maintenance let me know…
Until next time!
Files
- https://tools.wmflabs.org/wikidata-analysis/20181001/geo2png/map_huge.png
- https://tools.wmflabs.org/wikidata-analysis/20190513/geo2png/map_huge.png
- https://upload.wikimedia.org/wikipedia/commons/c/cd/Wikidata_items_map_with_difference%2C_October_2018_to_May_2019.png
All images used in this blog post are released under CC0.
Wow! That increase in West Bengal is awesome! 😃
I wonder who did it :) It’s normally just a one or so editors!
https://www.wikidata.org/wiki/Wikidata:WikiProject_West_Bengal#Participants
I think they’ve cumulatively made more than a million edits (XTools breaking because they’ve made so many edits 😜). So inspiring 😍
The growth in West Bengal is due to an import of health care facilities with coordinates by User:Bodhisattwa. (Soon he and I hope to have most Indian villages geolocated on Wikidata as well.) Bodhisattwa also imported most of the Indian rail network, with coordinates, to Wikidata (which I’m slowly connecting via P197).