Wikidata Map May – November 2019
It’s time for another blog post in my Wikidata map series, this time comparing the item maps that were generated on the 13th May 2019 and 11th November 2019 (roughly 6 months). I’ll again be using Resemble.js to generate a difference image highlighting changed areas in pink, and breakdown the areas that have had the greatest change throughout the 6 month period. The full comparison image can be found here.

If you don’t know what Wikidata is, or what items are then give this page a read. This map shows all items that have a “coordinate location” as a light pixel on a black canvas. The more items with coordinates in a single pixel, the brighter that pixel. This map is generated using code that can be found here.
The text descriptions work from left to right, and split the world into areas that make sense to picture and describe together.
If you notice anything that I have missed then please comment or tweet me and I will update this post! If you know the individuals or projects to thank for the areas of increase then please also comment so we can give them so recognition!
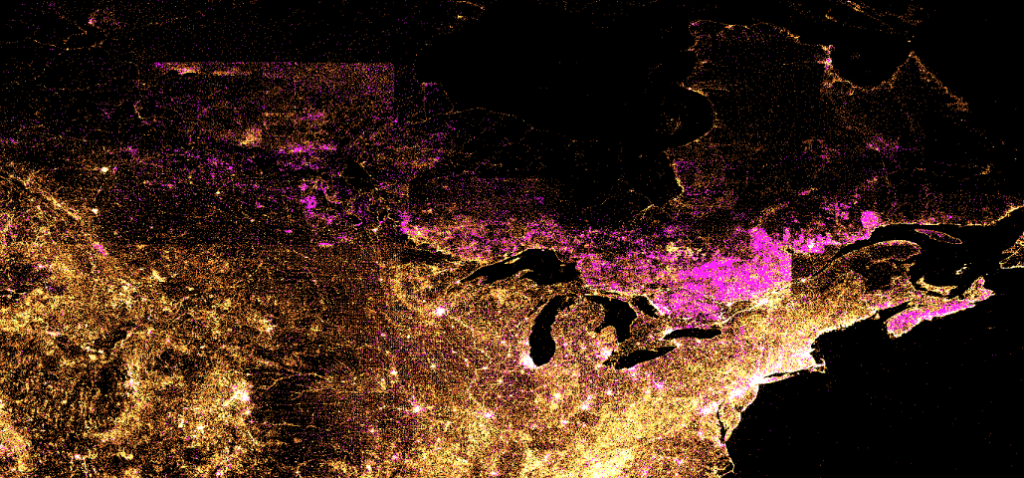
Canada
Item growth has been seen all across Canada with a particular area of increase in Ontario, Quebec and Nova Scotia. What appears to be the border line between Saskatchewan, Alberta and the North West Territories can also be seen as a fairly clear line of interest, with more items existing directly south of the border.
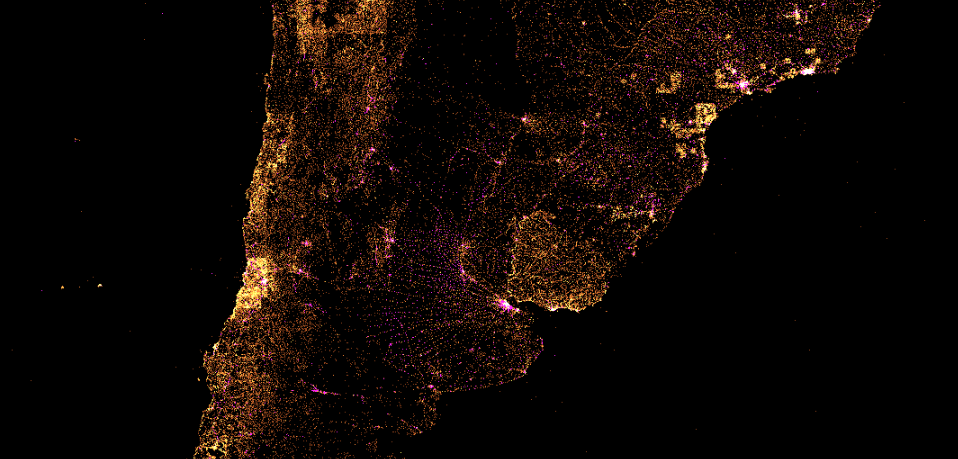
Argentina
Although Argentina has not seen a large growth, there is a noticeable growth around Buenos Aires and what appears to be the major road network across the country.
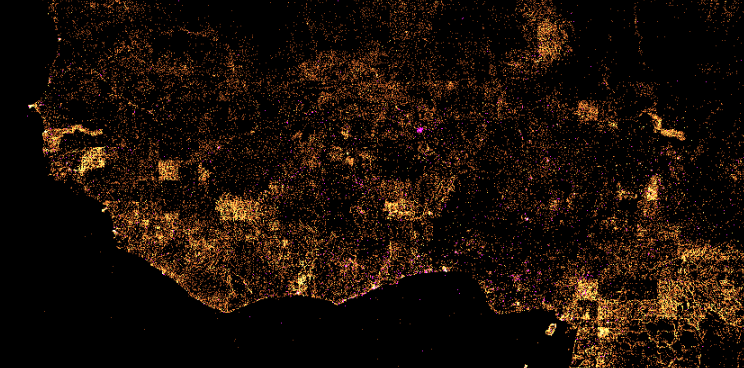
West Europe
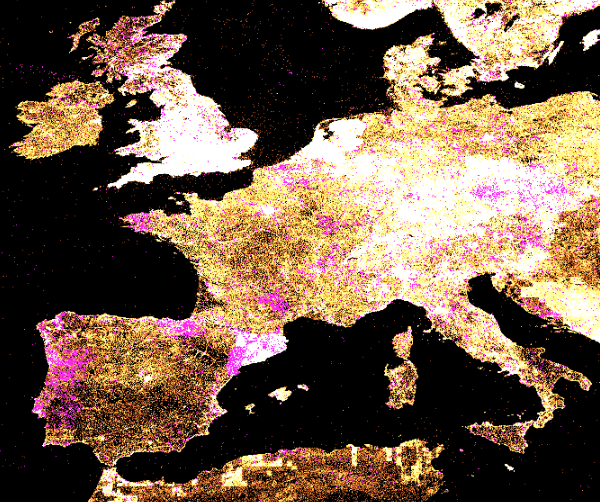
The most noticeable areas of increase in west Europe are; Portugal, which sees a general increase across the country and Spain, in the large areas around Barcelona, and also the area around Bilbao.
Many other countries in this area of Europe also saw an increase but either the map is fully saturated or I was not able to identify names areas.
It might be time to start generating some maps with different or varying intensities depending on the previous levels of item density.
Baltics
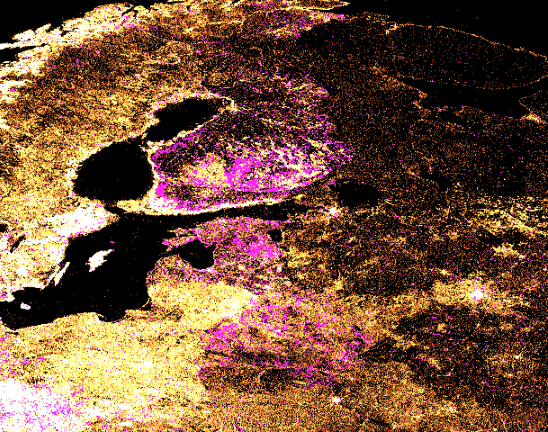
Looking toward the Baltics, Finland, Estonia, Latvia and Belarus all saw increases.
Finland seemed to see a general increase throughout with a particular increase in the South.
Estonia saw an increase focused around the Eastern areas including Tartu.
Africa
It is incredibly hard to pick out some of the points of increase in the African continent, and perhaps it is time for the to integrate a rough overlay of the world as we know it onto the map for easier identification.
The area that stands out the most by eye is either in Benin or Togo. I suspect but can not confirm that it is the city of Djougou.
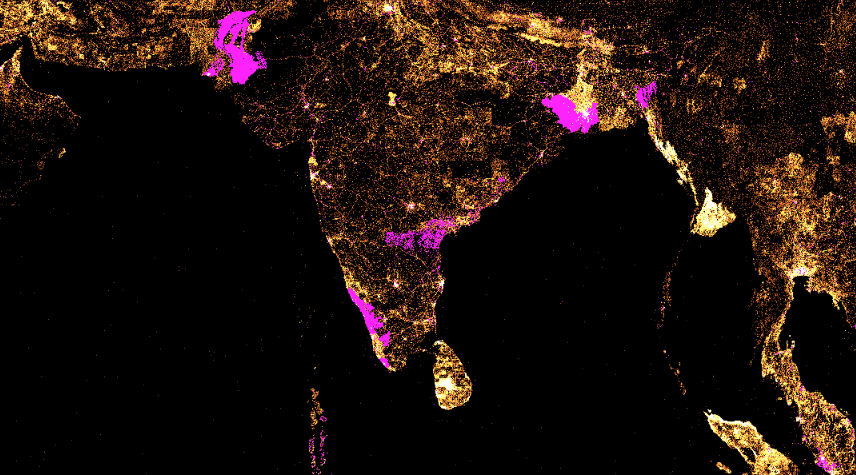
Asia
Generally looking at the continent of Asia there are a few major stand outs.
Pakistan is bright in pink indicating change, particularly in the southern area with a focus around Hyderabad and Karachi.
India has a very noticeable increase on the southern part of the west coast, I believe the state of Kerala. Also an area in the middle of the state of Andhra Pradesh has seen quite an increase. West Bengal and the area around Kolkata is also bright and has seen a great increase in item coverage.
Bangladesh can also be seen to have an increase in the southern area around Chattogram.
[…] been over a year since I last posted about the Wikidata Map, and my last blog only used coordinate data from the end of 2019. At WikidataCon 2021 we finally […]