VSCode seems to be one of the up and coming IDEs over the last year. I personally switched from Jetbrains IDEs to VSCode fo most of my development work at some point in 2020.
Apparently up until now I have avoided running the PHP debugger Xdebug. I had to do a little search around to figure out the correct settings for my setup decided to write them down in this handy blog post.

Where is the debugger?
VSCode doesn’t come with support for PHP Xdebug built in, so you need to add an extension. You probably want to download the one called “PHP Debug” with the most downloads (currently at 4.2 million).

XDebug Configuration
At the time of writing this the PHP Xdebug extension will provide three default snippets of debug configuration that might be useful. “Launch build-in server”, “Launch current script in console” and “Listen for Xdebug”. These will be useful if your simply running php on the same machine as VSCode.

Each configuration can be activated using the dropdown menu at the top of the debug panel. Just select the correct configuration and hit the play button.

This will start the debug client and load some more controls into another UI element. These buttons allow step through, over, into, restart and stop.
Local defaults / Same host
The default config for listening for Xdebug will work in most situations. This includes running all of this on localhost, OR running VSCode and PHP in WSL2.
        {
            "name": "Listen for Xdebug Remote",
            "type": "php",
            "request": "launch",
            "port": 9000,
        }Code language: JSON / JSON with Comments (json)
Make sure VSCode is listening for connections, and that you have a script with a breakpoint in it ready to run.
Then on the same host as VSCode you could then run the following to trigger a connection to the debug client. (Remember, you’ll need a breakpoint in a file to see it stop).
XDEBUG_CONFIG="client_port=9000 client_host=localhost remote_enable=1" php test.phpCode language: JavaScript (javascript)Docker / Containers
Debugging from docker containers can require a little more effort and will also differ between setups (Especially if using WLS2). In some setups the above localhost solution may already work for you!
VSCode will require you to add a hostname field to the debug configuration. This can be added for all cases as it will not stop local listens from working.
The hostname needs to be set to either localhost or 0.0.0.0
        {
            "name": "Listen for Xdebug Remote",
            "type": "php",
            "request": "launch",
            "port": 9000,
            "hostname": 0.0.0.0,
        }Code language: JSON / JSON with Comments (json)
If you are running docker on the same host as VSCode, then you should be able to trigger debug connections with the following (If you’re system supports host.docker.internal):
XDEBUG_CONFIG="client_port=9000 client_host=host.docker.internal remote_enable=1" php test.phpCode language: JavaScript (javascript)If you want a quick image to test this in I can recommend webdevops/php-dev.
WSL2 / Other remote hosts
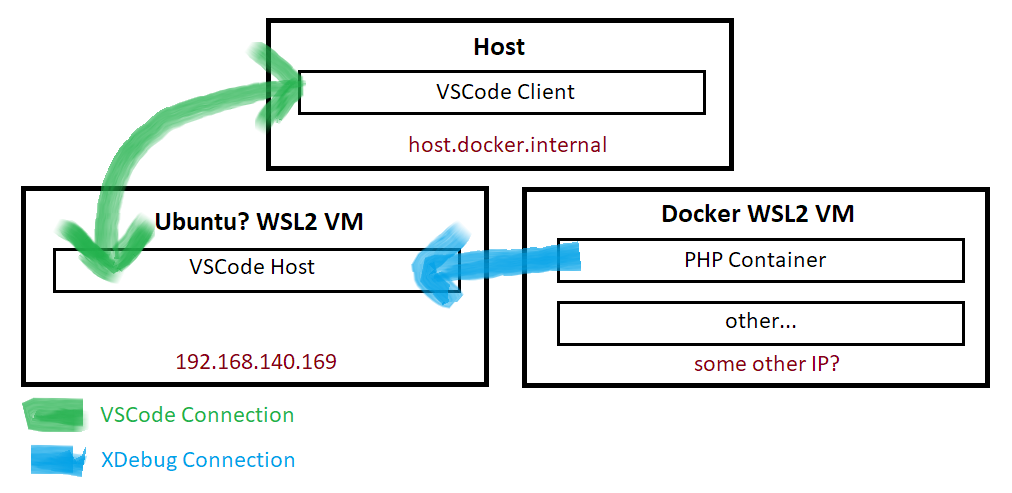
If you are NOT running VSCode on the same host, which will be the case if you are running VSCode in WSL2 mode on Windows, then currently you seem to need to specify the IP address of the WSL2 VM for the client_host.
You can get the WSL2 IP address used by VSCode by using ifconfig or by checking the log within VSCode which you can find with Remote-WSL: Show Log
If you’re using some other remote setup then you just need the IP address of your VSCode instance, as visible from wherever you’re running you’re code.
XDEBUG_CONFIG="client_port=9000 client_host=192.168.140.169 remote_enable=1" php test.phpCode language: JavaScript (javascript)Illustrating exactly what is happening here:
2 thoughts on “VSCode & PHP XDebug from Localhost, WSL2 and Docker containers”