Today I was in a Wikibase Stakeholder group call, and one of the discussions was around Wikibase importing speed, data loading, and the APIs. My previous blog post covering what happens when you make a new Wikibase item was raised, and we also got onto the topic of profiling.
So here comes another post looking at some of the internals of Wikibase, through the lens of profiling on test.wikidata.org.
The tools used to write this blog post for Wikimedia infrastructure are both open source, and also public. You can do similar profiling on both your own Wikibase, or for your requests that you suspect are slow on Wikimedia sites such as Wikidata.
Wikimedia Profiling
Profiling of Wikimedia sites is managed and maintained by the Wikimedia performance team. They have a blog, and one of the most recent posts was actually covering profiling PHP at scale in production, so if you want to know the details of how this is achieved give it a read.
Throughout this post I will be looking at data collected from a production Wikimedia request, by setting the X-Wikimedia-Debug header in my request. This header has a few options, and you can find the docs on wikitech.wikimedia.org. There are also browser extensions available to easily set this header on your requests.
I will be using the Wikimedia hosted XHGui to visualize the profile data. Wikimedia specific documentation for this interface also exists on wikitech.wikimedia.org. This interface contains a random set of profiled requests, as well as any requests that were specifically requested to be profiled.
Profiling PHP & MediaWiki
If you want to profile your own MediaWiki or Wikibase install, or PHP in general, then you should take a look at the mediawiki.org documentation page for this. You’ll likely want to use either Tideways or XDebug, but probably want to avoid having to setup any extra UI to visualize the data.
This profiling only covered the main PHP application (MediaWiki & Wikibase extension). Other services such as the query service would require separate profiling.
Making a profiled request
On test.wikidata I chose a not so random item (Q64) which happens to be a small version of the item for Berlin on Wikidata. It has a bunch of labels and a couple of statements.
I made a few modifications including removing the ID and changing all labels to avoid conflicts with the item that I had just copied and came up with some JSON ready to feed back into the API.
I navigated to the API sandbox for test.wikidata.org, and setup a request using wbeditentity which would allow me to create a fresh item. The options look something like this:
- new = item
- token = <Auto-fill the token using the UI button>
- data = <json data that I am using to create an item>
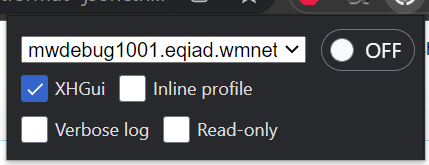
With the XHGui option selected in the WikimediaDebug browser extension, I can hit the “Make request” button and should see my item created. The next page will also output the full runtime of the request from the client perspective, in this case roughly 3.6 seconds.
Finding the request in XHGui
Opening up XHGui I should find the POST request that I just made to test.wikidata somewhere near the top of the list of profiled requests.
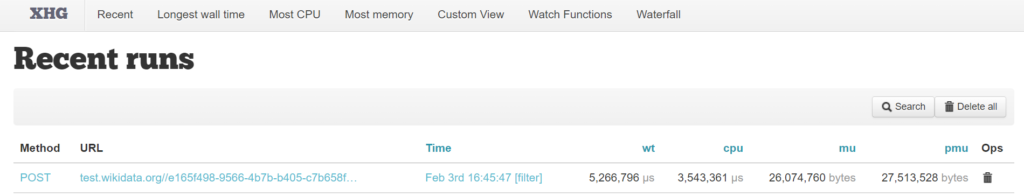
Clicking on the Time column, the details page of the profiled request will load. You can find my request, id 61fc06c1fe879940dbdf4a38 (archive URL just in case).
Profiling overview
There are lots of gotchas when it comes to reading a profile such as this:
- The fact that profiling is happening will generally make everything run slower
- Profiling tends to overestimate the cost of calling functions, so small functions called many times will appear to look worse than they actually are
- When IO is involved, such as caching (if the cache is cold), database writes, relying on the internet, or external services, any number of things can cause individual functions to become inflated
- It’s hard to know what any of it means, without knowing what the classes and methods are doing
Next let’s look at some terms that it makes sense to understand:
- Wall time: also called real-world time, is the actual time that a thing has taken to run. This includes things such as waiting for IO, or your CPU switching to low power mode.
- CPU time: also called process time, is the ammount of time the CPU actaully spent processing instructions, excluding things such as time spent waiting for IO.
- Self: also called exclusive, covers the resources spent in the function itself, excluding time spent in children.
- Inclusive: covers the resources inclusive of all children
You can read some more about different types of time and inclusivity in profiling on the Time docs for blackfire.io.
Reading the profile
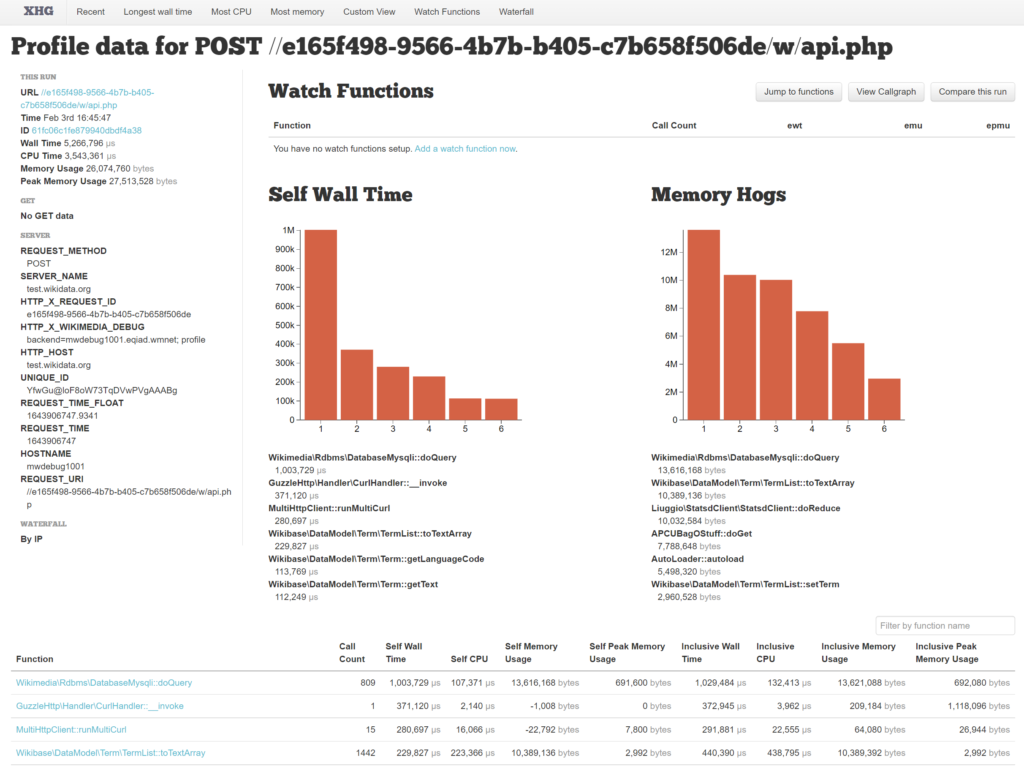
The full wall time of the request is 5,266,796 µs, or 5.2 seconds. This is significantly more than we saw from the perspective of the client making the API request. This is primarily because of the extra processing that MediaWiki and Wikibase does after sending a response back to the user.
The full CPU time of the request is 3,543,361 µs, or 3.5 seconds. We can infer from this that the request included roughly 1.7 seconds of time not doing computations. This could be waiting for databases, or other IO.
We can find likely candidates for this 1.7 seconds of time spent not computing by looking at the top of the function breakdown for wall time, and comparing CPU time.
| Method | Calls | Self Wall Time | Self CPU time | Difference |
| Wikimedia\Rdbms\DatabaseMysqli::doQuery | 809 | 1,003,729 µs | 107,371 µs | ~ 0.9 s |
| GuzzleHttp\Handler\CurlHandler::__invoke | 1 | 371,120 µs | 2,140 µs | ~ 0.3 s |
| MultiHttpClient::runMultiCurl | 15 | 280,697 µs | 16,066 µs | ~ 0.25 s |
| Wikimedia\Rdbms\DatabaseMysqli::mysqlConnect | 45 | 68,183 µs | 15,229 µs | ~ 0.05 s |
The 4 methods above have a combined difference between wall and CPU time of 1.5s, which accounts for most of the 1.7s we were looking for. The most expensive method call here is actually the single call to GuzzleHttp\Handler\CurlHandler::__invoke which spends 0.3s waiting, as all of the other methods are called many other times. On average Wikimedia\Rdbms\DatabaseMysqli::doQuery only spends 0.001s per method call in this request.
GuzzleHttp\Handler\CurlHandler::__invoke
Lets have a closer look at this GuzzleHttp\Handler\CurlHandler::__invoke call. We have a few options to see what is actually happening in this method call.
- Click on the method to see the details of the call, navigate up through the parents to find something that starts to make some sense
- Use the callgraph view (only shows methods that represent more than 1% of execution time)
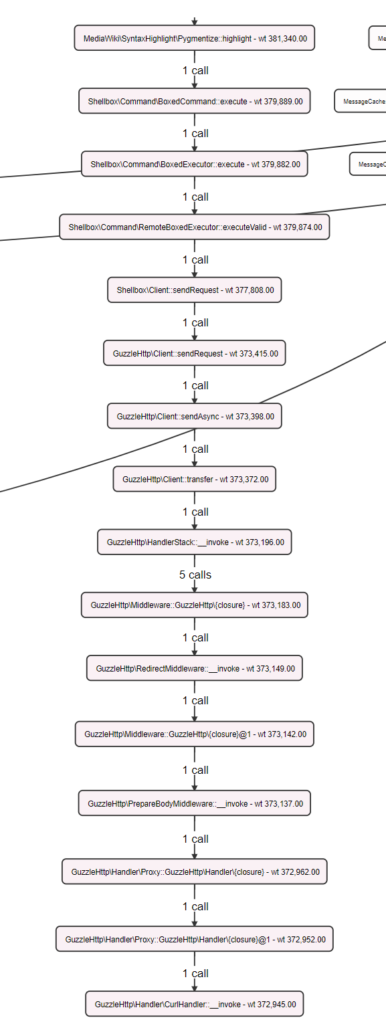
I’ll choose number 2, and have included a screenshot of the very tall call graph for this method to the right.
At the top of this call we see MediaWiki\SyntaxHighlight\Pygmentize::highlight, which I was not expecting in such an API call.
Another level up we see WANObjectCache::fetchOrRegenerate which means that this was involved in a cache miss, and this data was regenerated.
Even further up the same tree I see SyntaxHighlight::onApiFormatHighlight.
This method is part of the SyntaxHighlight extension, and spends some time making the output of the API pretty for users in a web browser.
So what have I learnt here? Don’t profile with jsonfm. However using the API sandbox you don’t get this option, and thus bug T300909 was born.
Callgraph overview
Having the callgraph open we can see some of the most “expensive” methods in terms of inclusive wall time. You can also find these in the table view by sorting using the headings.
main() represents the bulk of the MediaWiki request (5.2s). This is split into ApiMain::execute taking ~3.4 seconds, and MediaWiki::doPostOutputShutdown taking ~1.7 seconds.
ApiMain::execute
This is where the “magic happens” so to speak. ~3.4 seconds of execution time.
The first bit of Wikibase code you will see in this call graph path is Wikibase\Repo\Api\ModifyEntity::execute. This is the main execute method in the base class that is used by the API that we are calling. Moving to this Wikibase code we also lose another ~0.4 seconds due to my syntax highlighting issue that we can ignore.
Taking a look at the next level of methods in the order they run (roughly) we see most of the execution time.
| Method | Inclusive Wall time | Description |
| Wikibase\Repo\Api\ModifyEntity::loadEntityFromSavingHelper | ~0.2 seconds | Load the entity (if exists) that is being edited |
| Wikibase\Repo\Api\EditEntity::getChangeOp | ~0.6 seconds | Takes your API input and turns it into ChangeOp objects (previous post) |
| Wikibase\Repo\Api\ModifyEntity::checkPermissions | ~0.3 seconds | Checks the user permissions to perform the action |
| Wikibase\Repo\Api\EditEntity::modifyEntity | ~1.8 seconds | Take the ChangeOp objects and apply them to an Entity (previous post) |
| Wikibase\Repo\Api\EntitySavingHelper::attemptSaveEntity | ~0.4 seconds | Take the Entity and persist it in the SQL database |
In the context of the Wikibase stakeholder group call I was in today that was talking about initial import speeds, and general editing speeds, what could I say about this?
- Why spend 0.3 seconds of an API call checking permissions? Perhaps you are are doing your initial import in a rather “safe” environment. Perhaps You don’t care about all of the permissions that are checked?
- Permissions are currnetly checked in 3 places for this call. 1) upfront 2) if we need to create a new item 3) just before saving. In total this makes up ~0.6 seconds according to the profiling.
- Putting the formed PHP Item object into the database actually only takes ~0.15 seconds.
- Checking the uniqueness of of labels and descriptions takes up ~1.2 seconds of validation of ChangeOps. Perhaps you don’t want that?
MediaWiki::doPostOutputShutdown
This is some of the last code to run as part of a request.
The name implies it, but to be clear this PostOutputShutdown method runs after the user has been served with a request. Taking a look back at the user-perceived time of 3.6 seconds, we can see that the wall time of the whole request (5.2s) minus this post output shutdown (1.7s) is roughly 3.5 seconds.
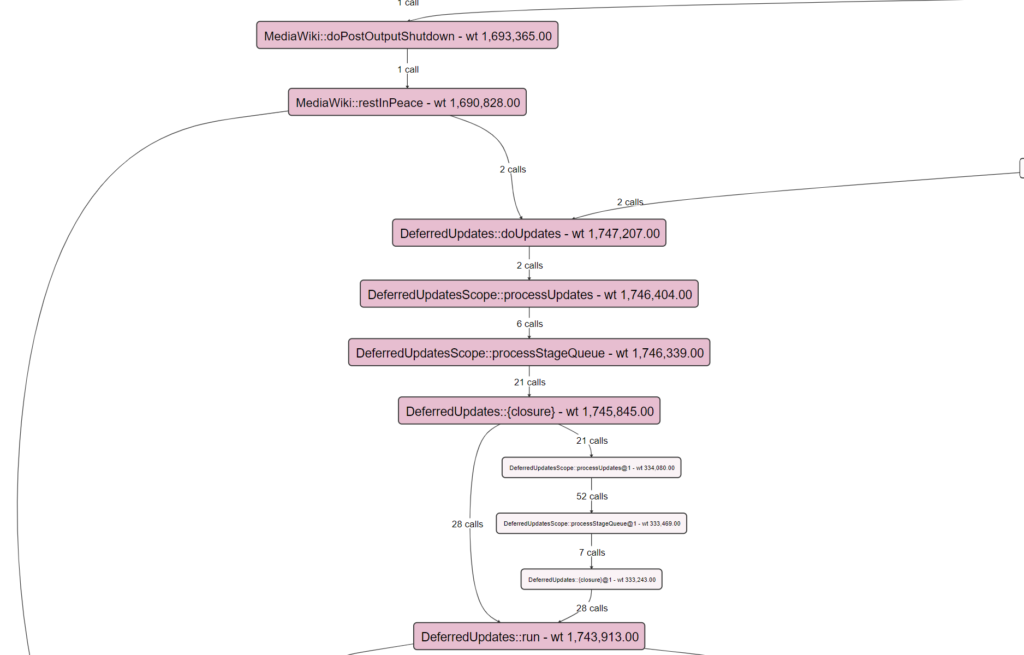
In relation to my previous post from the point of view of Wikibase, this is when most secondary data updates will happen. Some POST SEND derived data updates also happen in this step.
Closing
As I stated in the call, Wikibase was created primarily with the usecase of Wikidata in mind. There was never a “mass data load” stage for Wikidata requiring extremely high edit rates in order to import thoughts or millions of items. Thus interfaces and internals do not tend to this usecase and optimizations or configurations that could be made have not been made.
I hope that this post will trigger some questions around expensive parts of the editing flow (in terms of time) and also springboard more folks into looking at profiling of either Wikidata and test.wikidata, or their own Wikibase installs.
For your specific use case you may see some easy wins with what is outlined above. But remember that this post and specific profiling is only the tip of the iceberg, and there are many other areas to look at.
2 thoughts on “Profiling a Wikibase item creation on test.wikidata.org”