Back in 2019 at the start of the COVID-19 outbreak, Wikipedia saw large spikes in page views on COVID-19 related topics while people here hunting for information.
I briefly looked at some of the spikes in March 2020 using the easy-to-use pageview tool for Wikimedia sites. But the problem with viewing the spikes through this tool is that you can only look at 10 pages at a time on a single site, when in reality you’d want to look at many pages relating to a topic, across multiple sites at once.
I wrote a notebook to do just this, submitted it for privacy review, and I am finally getting around to putting some of those moving parts and visualizations in public view.
Methodology
It certainly isn’t perfect, but the representation of spikes is much more accurate than looking at a single Wikipedia or set of hand selected pages.
- Find statements on Wikidata that relate to COVID-19 items
- Find Wikipedia site links for these items
- Find previous names of these pages if they have been moved
- Lookup pageviews for all titles in the pageview_hourly dataset
- Compile into a gigantic table and make some graphs using plotly
I’ll come onto the details later, but first for the…
Graphics
All graphics generally show an initial peak in the run-up to the WHO declaring an international public health emergency (12 Feb 2020), and another peak starting prior to the WHO declaring a pandemic.
Be sure to have a look at the interactive views of each diagram to really see the details.

The per access method graphic shows a much steeper set of spikes on mobile web than on desktop, with mobile app traffic being negligible.
During the first peak, mobile web is roughly 3x that of desktop, and during the second peak that changes to roughly 1.6x. Throughout the tail of the data, mobile web and desktop pageviews stay relatively level.
Generally speaking, during this period of time mobile web views and desktop views for Wikimedia sites were roughly even, though before mid 2019 there were notably less mobile web views than desktop views, and post mid 2022 there were notably more mobile web views than desktop views.

Looking at the per continent data, although the initial spike look fairly similar, there are some notable difference in peaks of the second spike.
- Europe, North America: 12 March 2020
- South America: 12 March 2020
- Oceana: 22 March 2020
- Asia, Africa: 23 March 2020
There are other notable increases in the long tail, but nothing that I dug into.

I also visualized this data on a per country level, but per the country protection list cited in the privacy review, I won’t be including that graphic.
Generation details
I won’t include the raw notebook, as it includes data that I don’t want to include per the privacy review. It’s also old and unlikely to work in it current state, but hopefully the flow and these snippets can be made useful for similar projects in the future.
Starting with Wikidata, I needed statements that related to COVID-19 items. I ended up with:
- Facet of (P1269) => 2019–20 COVID-19 pandemic (Q81068910)
- Part of (P361) => 2019–20 coronavirus pandemic by country and territory (Q83741704)
- Maintained by WikiProject (P6104) => WikiProject COVID-19 (Q87748614)
Defining these as snippets of a SPARQL query that I’d be constructing
lookupWikidataStatements = [
    # Facet of => 2019–20 COVID-19 pandemic
    'wdt:P1269 wd:Q81068910',
    # Part of => 2019–20 coronavirus pandemic by country and territory
    'wdt:P361 wd:Q83741704',
    # Maintained by WikiProject => WikiProject COVID-19
    'wdt:P6104 wd:Q87748614',
]Code language: PHP (php)
Due to the possible long query time, I ran the query on an internal cluster endpoint, which has a longer timeout than the public query service.
I loop through the query snippets running 1 query each, adding all the data to a pandas data frame.
Ultimately, the resulting queries look something like this.
from SPARQLWrapper import SPARQLWrapper, JSON
from pandas import json_normalize
import pandas as pd
sparqlEndpoint = "http://wdqs2001.codfw.wmnet:8888/sparql"
def query_wikidata(sparql_query, sparql_service_url):
"""
Query the endpoint with the given query string and return the results as a pandas Dataframe.
"""
sparql = SPARQLWrapper(sparql_service_url, agent="Sparql Wrapper on Jupyter (addshore)")
sparql.setQuery(sparql_query)
sparql.setReturnFormat(JSON)
result = sparql.query().convert()
return json_normalize(result["results"]["bindings"])
def get_sparql(propertyValueMatcher):
return """
SELECT DISTINCT ?page
WHERE {
?item """+propertyValueMatcher+""".
?sitelink schema:about ?item.
?sitelink schema:isPartOf [ wikibase:wikiGroup 'wikipedia' ].
?sitelink schema:name ?page.
}"""
# Run a query for each lookup statement
sparqlResults = []
for matcher in lookupWikidataStatements:
sparqlResults.append(query_wikidata(get_sparql(matcher), sparqlEndpoint))
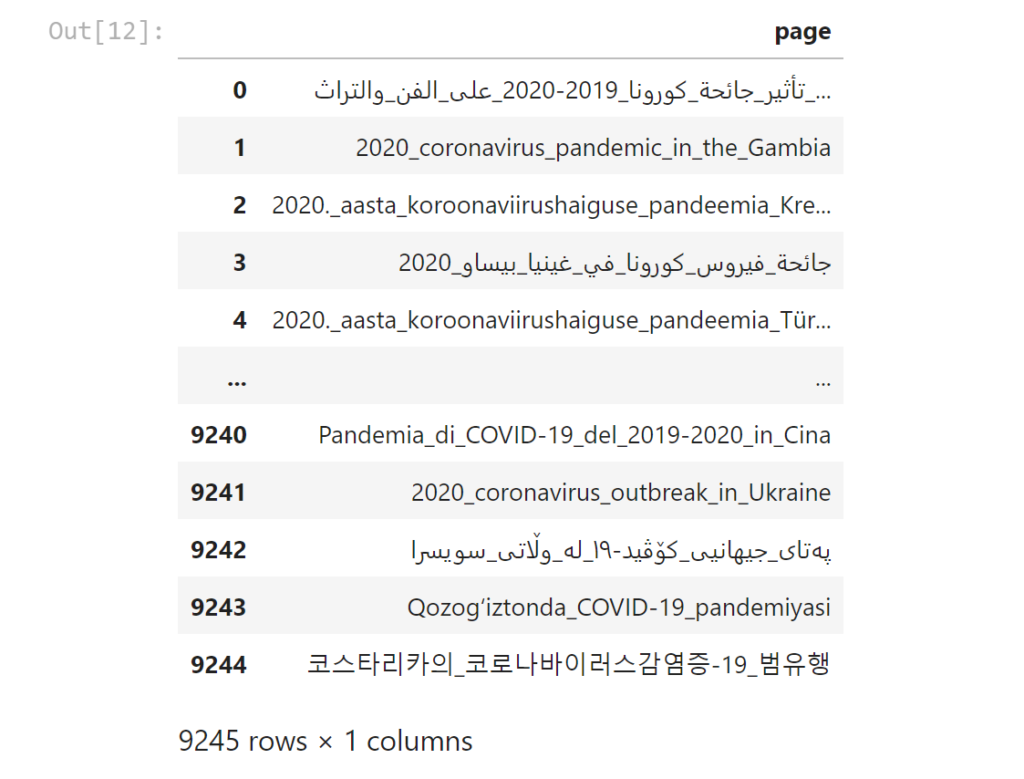
sparqlResult = pd.concat(sparqlResults)Code language: PHP (php)A sample of these page names (truncated) would be something like:
- Dòng_thời_gian_của_đại_dịch_COVID-19_tháng_6_n…
- Technical_Advisory_Group_on_SARS-CoV-2_Virus_E…
- Andoza:COVID-19_pandemiyasi_holatlari
- Àdàkọ:Iye_àwọn_aláìsàn_àjàkálẹ̀-àrún_COVID-19
- …
In order to get all possible historical page names, I made use of both the event.mediawiki_page_move and wmf.mediawiki_page_history datasets that make up part of the WMF data lake.
I seem to remember wanting to use both of these data sets as I determined that just one would leave to an incomplete page list due to reasons that I no longer remember and did not write down.
pandaPageMoveNames = spark.sql("""
SELECT DISTINCT prior_state.page_title
FROM event.mediawiki_page_move
WHERE ( <PERIOD_CONDITION> )
AND page_namespace = 0
AND page_title IN ( SELECT page FROM addshore_temp_topic_pages_current )
""".replace("<PERIOD_CONDITION>", sqlPeriod)).toPandas().rename({"page_title":"page"},axis='columns')
pandaPageMoveNames

pandaPageHistoryNames = spark.sql("""
SELECT DISTINCT page_title_historical
FROM wmf.mediawiki_page_history
WHERE mediawiki_page_history.snapshot = "<SNAPSHOT>"
AND mediawiki_page_history.page_namespace_historical = 0
AND (
mediawiki_page_history.page_title IN ( SELECT * FROM addshore_temp_topic_pages_current )
OR mediawiki_page_history.page_title IN ( SELECT * FROM addshore_temp_topic_pages_mediawiki_moves )
)
""".replace("<SNAPSHOT>",snapshot)).toPandas().rename({"page_title_historical":"page"},axis='columns')
pandaPageHistoryNamesCode language: PHP (php)
These moves and history checks introduced more page names, such as (truncated):
- 2020._aasta_koroonaviirushaiguse_pandeemia_Kre…
- Gondurasda_COVID-19_pandemiyasi
- Pandemi_koronavirus_2019_di_Indonesia
- Pandemi_koronavirus_2019_di_Jerman
- Дефицитмикросхем(2020—2021)
- Pandemia_di_COVID-19_del_2019-2020_in_Cina
- …
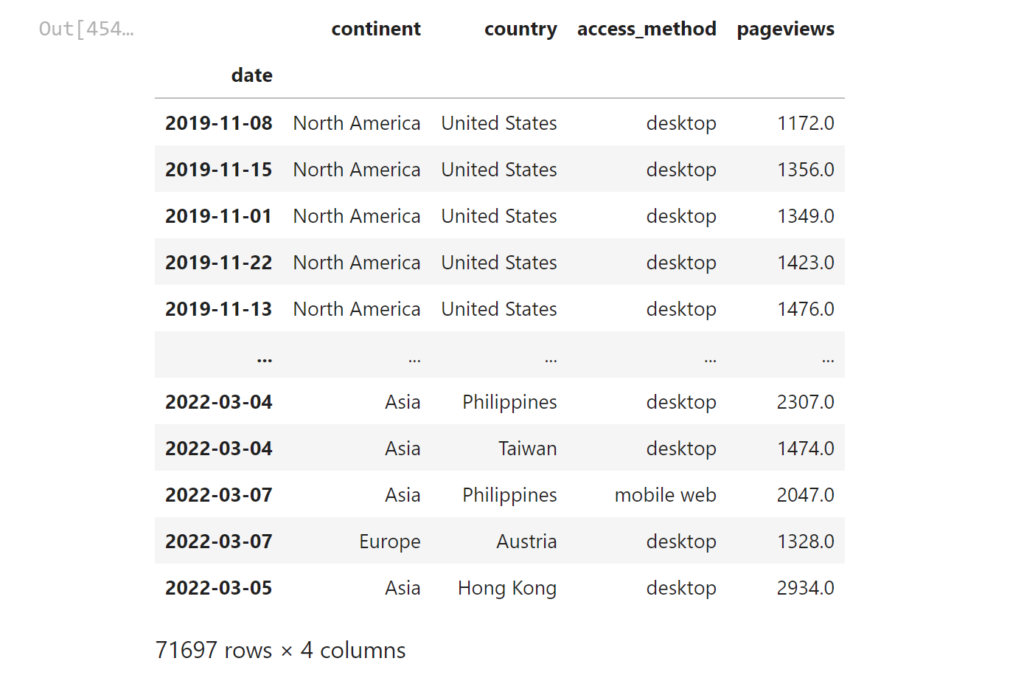
Finally, time to retrieve all the page view information for the period, grouped by all the aspects that I wanted to explore.
This is a rather expensive query which on my last run resulted in a table of 71,697 rows, however generation of this table will have scanned all pageview data for all Wikimedia sites for a period of multiple years (quite a bit of data).
for period in sqlPeriods:
    pandaPageviews = spark.sql("""
SELECT year, month, day,
continent, country, access_method,
SUM(view_count) AS pageviews
FROM wmf.pageview_hourly
WHERE ( <PERIOD_CONDITION> )
AND namespace_id IN ( 0, 1 )
AND agent_type = "user"
AND page_title IN ( SELECT * FROM addshore_temp_topic_pages_all )
GROUP BY continent, country, access_method, year, month, day
LIMIT 10000000
""".replace("<PERIOD_CONDITION>",period)).registerTempTable("addshore_temp_topic_pageviews_" + period_to_string(period))Code language: PHP (php)
The actual data looks something like this…
I defined a collection of events to visualize alongside the data
events = [
    {"date":"2019-12-01", "text":"Symptoms of the index case began"},
    {"date":"2019-12-27", "text":"First novel disease report"},
    {"date":"2020-01-30", "text":"WHO declare an International Public Health Emergency"},
    {"date":"2020-03-11", "text":"WHO declare a pandemic"},
    {"date":"2020-12-14", "text":"Alpha Varient discovered"},
    {"date":"2020-07-01", "text":"Beta Varient discovered"},
    {"date":"2021-01-06", "text":"Gamma Varient discovered"},
    {"date":"2021-05-31", "text":"Delta Varient named"},
    {"date":"2021-11-24", "text":"Omicron discovered"},
]Code language: JavaScript (javascript)
And wrote some questionable code to throw the data into a niceish looking plotly diagram.
You can find the various functions defined and used in a public gist.
The graphs could then simply be rendered with this code
do_plotly_simple(
    data=dfToPlot.loc[startDay:endDay].groupby(['date'])['pageviews'].sum(),
    title=topicTitle + " related Wikimedia pageviews",
)
do_plotly_group(
    rawData=dfToPlot.loc[startDay:endDay],
    groupBy="access_method",
    title=topicTitle + " related Wikimedia pageviews, by access method",
)
do_plotly_group(
    rawData=dfToPlot.loc[startDay:endDay],
    groupBy="continent",
    title=topicTitle + " related Wikimedia pageviews, by continent",
)Code language: JavaScript (javascript)
Other datasets
The privacy review for my data flagged up a couple of other datasets that had been released around COVID-19 and Wikipedia.
- WIKIPEDIA AND COVID-19 by the Wikimedia Foundation
- COVID-19 Wikipedia Data: Data about COVID-19 related articles across Wikipedia projects
- github.com/geohci/covid-19-sessions: Generate Wikipedia reader sessions for research into Covid-19 reading behaviour
It looks like the pages that end up within the COVID-19 topic with the methodology of the second link here (COVID-19 Wikipedia Data) has a few issues, for example, these pages appear in the data set
- https://af.wikipedia.org/wiki/2020_Superrugbyseisoen (English equvilent 2020 Super Rugby season)
- https://als.wikipedia.org/wiki/Engadin_Skimarathon (English equvilent Engadin Skimarathon)
Looking at the notebook, Wikipedia page backlinks are used alongside a possible wider set of SPARQL query page matchers.
A total of 10,538 individual pages are found for the dataset, slightly more than the 9245 page titles I found, though these are different things. Page title being a string that may appear across multiple sites, vs pages which are per site.
Further reading
Collective Response to Media Coverage of the COVID-19 Pandemic on Reddit and Wikipedia: Mixed-Methods Analysis Published on 12.10.2020 in Vol 22 , No 10 (2020) :October doi:10.2196/21597
Volunteer contributions to Wikipedia increased during COVID-19 mobility restrictions Scientific Reports volume 11, Article number: 21505 (2021)
A Google–Wikipedia–Twitter Model as a Leading Indicator of the Numbers of Coronavirus Deaths Published online 2020 Sep 28 doi: 10.1002/isaf.1482
Open data and COVID-19: Language diversity on Wikipedia Diego Sáez-Trumper May 14, 2020
1 thought on “COVID-19 Wikipedia pageview spikes, 2019-2022”