Windows 11 (and possibly previous versions of windows) have a data usage view built into the advanced network settings view.
This feature allows users to monitor and manage their data usage on both Wi-Fi and wired connections, and I assume also data connections if your device can be connected via a SIM.
The Data usage page only allows you to see the current usage of networks that you are connected to, and doesn’t allow you to get a view of the whole picture.
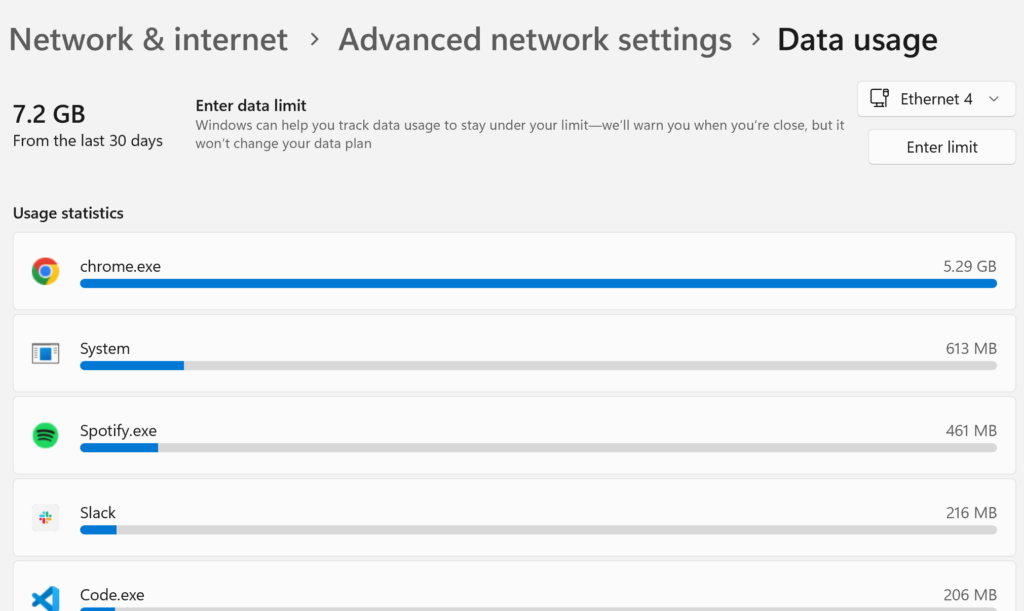
For example, my current “Ethernet 4” usage is 7.2GB in the last 30 days, and the current Wi-Fi network that I am on has 97.1GB usage in the last 30 days.
However, I spend lots of time on other networks, and would love to know my overall data usage in the past 30 days.
Where is the data?
I figured all of the data was stored somewhere on disk, the real questions was where.
After a fair bit of googling I came accros “SRUM” or “System Resource Usage Monitor”, and “SRUDB.dat” referenced quite a lot:
- SRUM: Forensic Analysis of Windows System Resource Utilization Monitor
- System Resource Usage Monitor (SRUM)
And it turns out, this is where the data is!
SRUDB.dat files are part of the Windows Diagnostic Infrastructure and are used to store diagnostic information related to system reliability and performance.
SRUDB.dat files, also known as Service Reporting Usage Database files, are typically located in the C:\Windows\System32\sru folder. They contain data about system events, application failures, hardware failures, and other diagnostic information.
SRUM uses the Extensible Storage Engine (ESE) Database File (EDB) to store its data.
Getting the data
Wanting to find a quick and easy way to get at this data I did more searching online and found a couple of projects on Github that appeared to work in the area.
And eventually I came up with some steps that allowed me to get a CSV copy of the data.
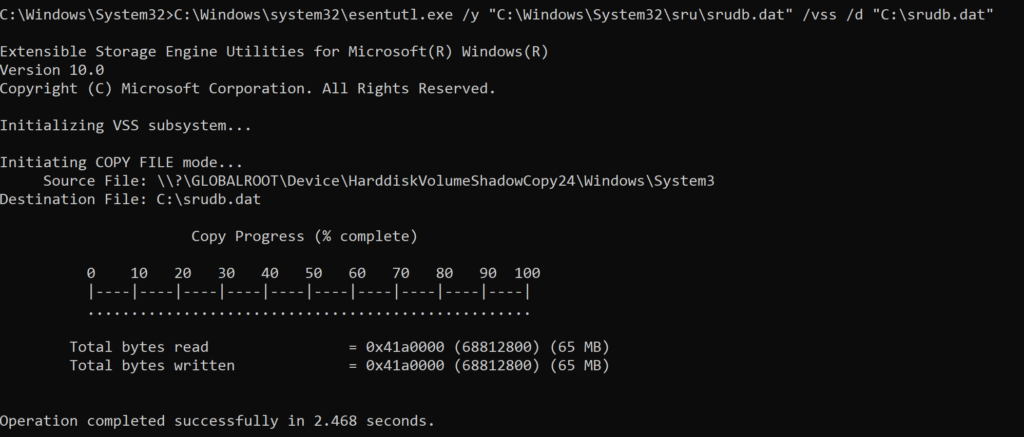
Firstly, using a tool that comes with Windows called Esentutl you can create a copy of the .dat file. This must be done to avoid screwing with whatever Windows is doing with that file. You’ll need to run this as administrator in powershell or cmd.
C:\Windows\system32\esentutl.exe /y "C:\Windows\System32\sru\srudb.dat" /vss /d "C:\srumstuff\srudb.dat"Code language: JavaScript (javascript)Your output should look something like this
You can then grab SrumECmd.exe from Eric Zimmerman’s page.
C:\SrumECmd.exe -f C:\srudb.dat --csv C:\Code language: CSS (css)The output of this command should look something like this
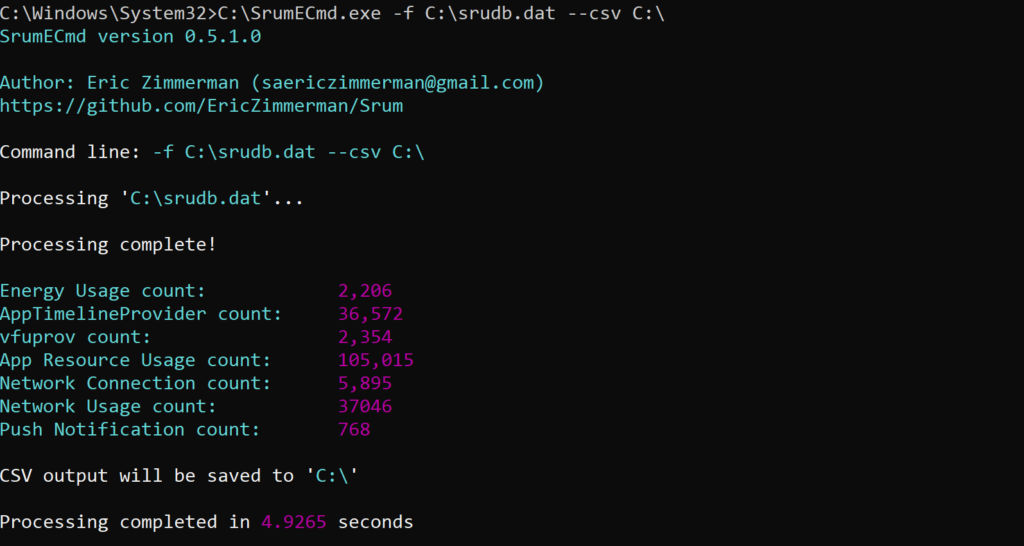
And you should then find a bunch of CSV files on disk.
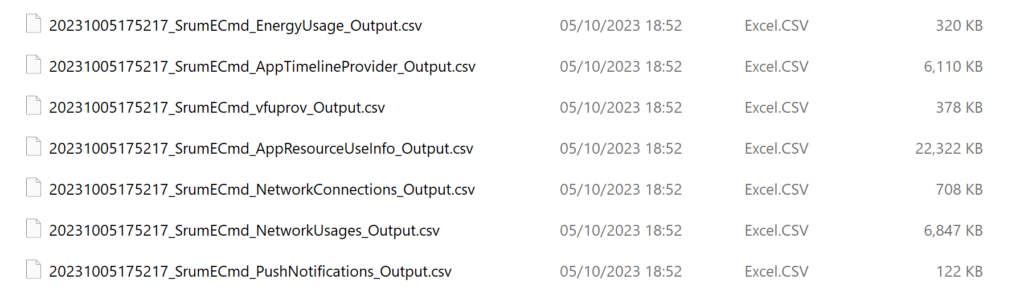
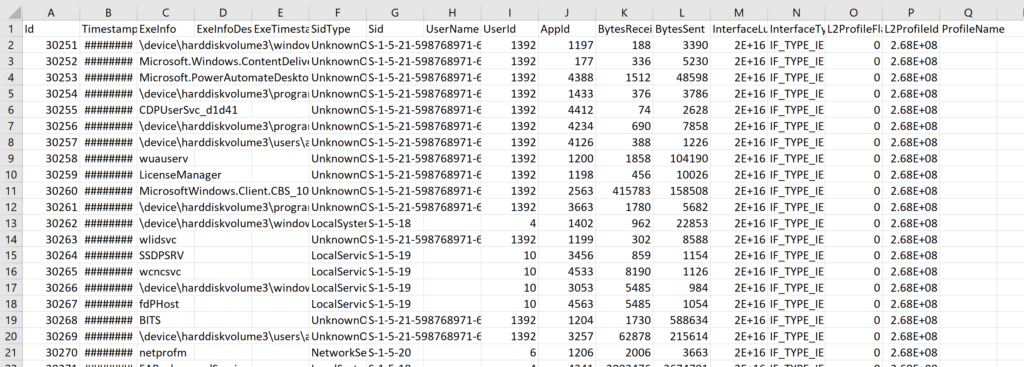
Note one is called “NetworkUsages”, with 6.7MB of data that looks something like this
Understanding the data?
I am in no way an authoritative voice in terms of what these columns ultimately mean, but I managed to find 2 resources that speak to them a little.
https://github.com/libyal/esedb-kb/documentation/System Resource Usage Monitor (SRUM).asciidoc notes that some IDs related to other tables in the SRUM DB, and also specifies the types of values to be expected in a table called 973F5D5C-1D90-4944-BE8E-24B94231A174 which I can only assume is where we just extracted our data from.
Magnet Forensics appear to have a tool in which the SRUM information can be viewed and analysed.
From a post on their site:
As seen in the example, there are multiple entries for the same exe. Think of these like TCP sessions with the same destination. In this case, it’s different application ‘sessions.’ If you need to quantify to total bytes sent or received for an application, highlight your included results and export to CSV. A quick pivot table in Excel will give you the cumulative results (in bytes) by application.
SRUM: Forensic Analysis of System Resource Utilization Monitor (magnetforensics.com)
According to a combination of Bing AI search and ChatGPT…
- Id: This is a unique identifier for each record in the database.
- Timestamp: This is the time when the record was created.
- ExeInfo: This field contains information about the executable (program) that generated the network traffic.
- ExeInfoDescription: This field provides a description of the executable.
- ExeTimestamp: This is the timestamp of the executable file.
- SidType: This field indicates the type of Security Identifier (SID) which is a unique value used to identify a user or group within Windows.
- Sid: This is the actual Security Identifier (SID) value.
- UserName: This field contains the name of the user who was running the executable.
- UserId: This is a unique identifier for the user.
- AppId: This is a unique identifier for the application that generated the network traffic.
- BytesReceived: This field shows the number of bytes received by the application over the network.
- BytesSent: This field shows the number of bytes sent by the application over the network.
- InterfaceLuid: This is a locally unique identifier for the network interface used by the application.
- InterfaceType: This field indicates the type of network interface used (e.g., Wi-Fi, Ethernet).
- L2ProfileFlags and L2ProfileId: These fields contain information about the Layer 2 profile, which relates to data link layer in OSI model, used by the network interface.
- ProfileName: This field contains the name of the network profile used
Exploring some data
I have, roughly, 1134 rows for chrome.exe, my current main browser.
The latest timestamp is 2023-10-05 16:54:00 (a few hours ago), and the oldest timestamp is 2023-08-07 08:19:00, so roughly but not quite 2 months ago.
InterfaceType always appears to be either IF_TYPE_IEEE80211 or IF_TYPE_ETHERNET_CSMACD. The former referring to WiFi and the latter referring to an Ethernet connection.
The WiFi rows all appear to have differing L2ProfileId values, I assume relating to the WiFi network the data was used on. I have 9 unique values here.
For those rows, I have 10 different L2ProfileId entries.
These rows SUM to a total of 301047322046 bytes received and 45040506321 bytes sent. In my human-readable terms, this is 301 GB bytes received and 45 GB bytes sent. The last 30 days still sum to some rather large numbers, 283 GB received and 10.5 GB bytes sent. So the SUMs don’t appear to match up with the data I was seeing in the “Data usage” settings page.
What does it mean?
There is data there.
I am not convinced I know what it means.
I am not sure how it ties to the numbers you see in “Data usage”.
More investigation needed…

Very useful. For “what does it mean?” – now can see who was banging the drive at 10/8/2023 12:55:00 AM (Microsoft.Windows.Search). Now have a readable log to check when suspicious about network traffic.
Thanks, I was looking for this. 💕