Overlap Atlas (Android timeline overlaps)

Introducing Overlap Atlas! Very similar to another little web app that I made a few weeks ago, making use of Android timeline data and Spotify data, I now have another little web app for visualizing overlaps of 2 peoples timeline data (or lack of overlaps).

You can load one or more Google Timeline exports into the app and assign them to specific people. Just like the last project, your uploaded data stays securely in your browser. Once your files are loaded, you can draw geofences to outline areas to look at and split out.
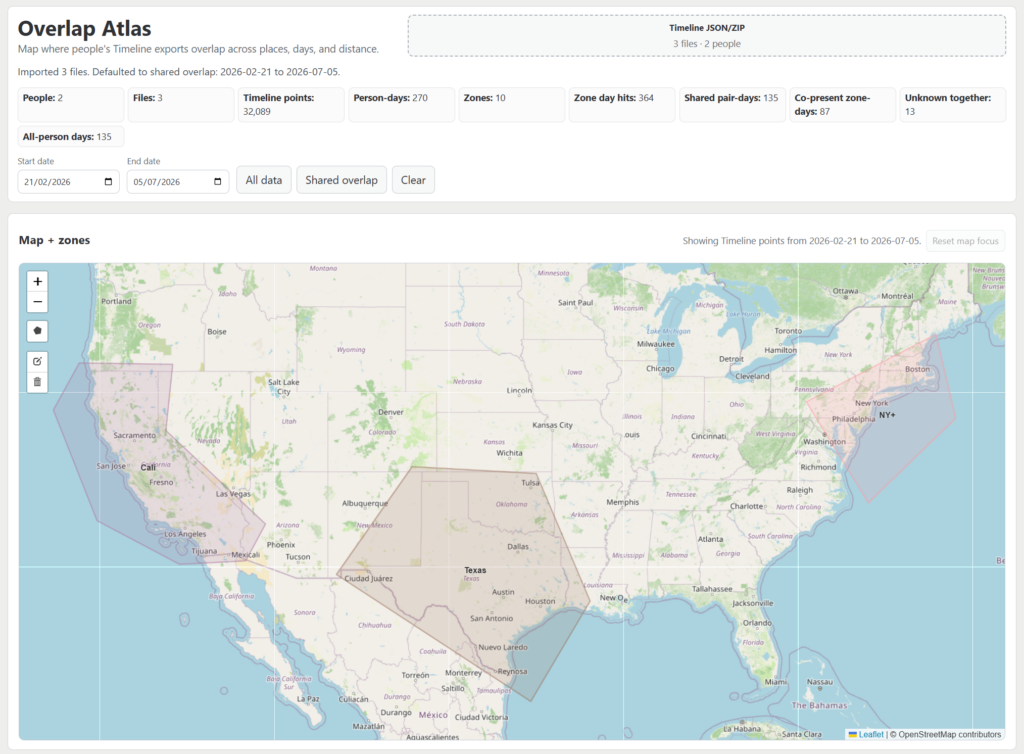
From there, you get multiple visualizations for where people have been, and when and where overlaps happen:
Read more

Dartmoor camping related map data (UK)

I’m about to head camping on Dartmoor, and wanted to go prepped with some of the various map related data that I will need. Basically, where to camp, and where not to camp…

Searching around I managed to find this basic set of infomation

And from that went and found some slightly more structured mapping information about the area

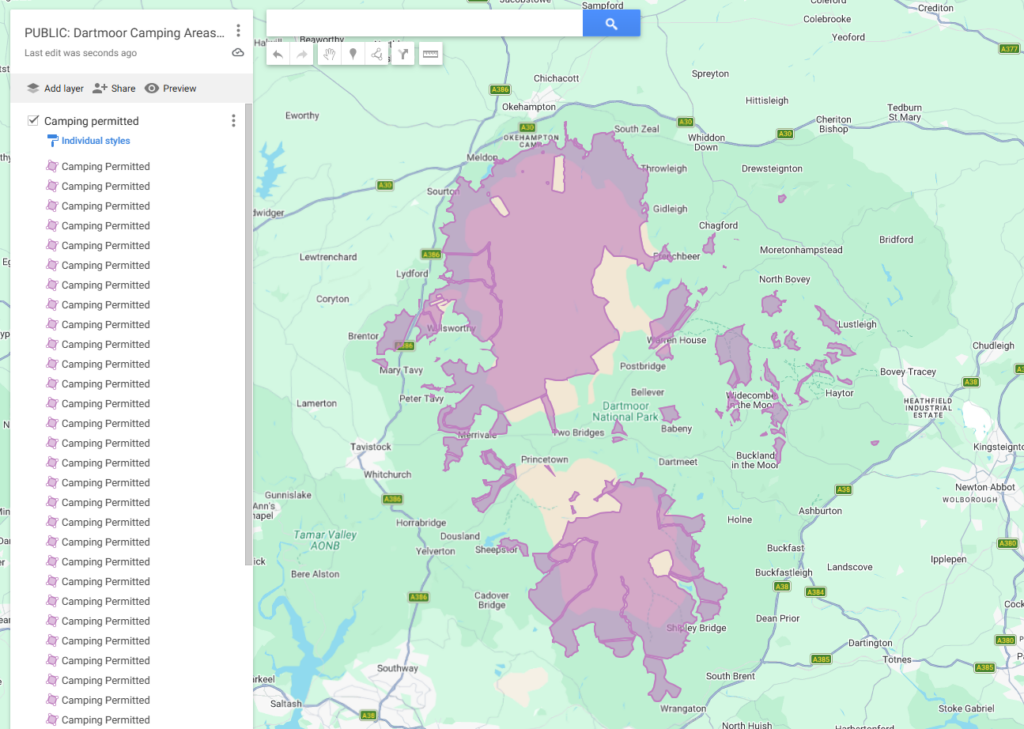
The camping locations KML can be downloads and used however you want. For convenience I have re uploaded the current file to this Google Maps map.

The OpenStreetMap data can also be extracted and converts to KML, and uploaded to Google maps, which I have done so for the current versions on this Google Maps map.

Read more

Wikidata Map in 2025

This entry is part 17 of 17 in the series Wikidata Map

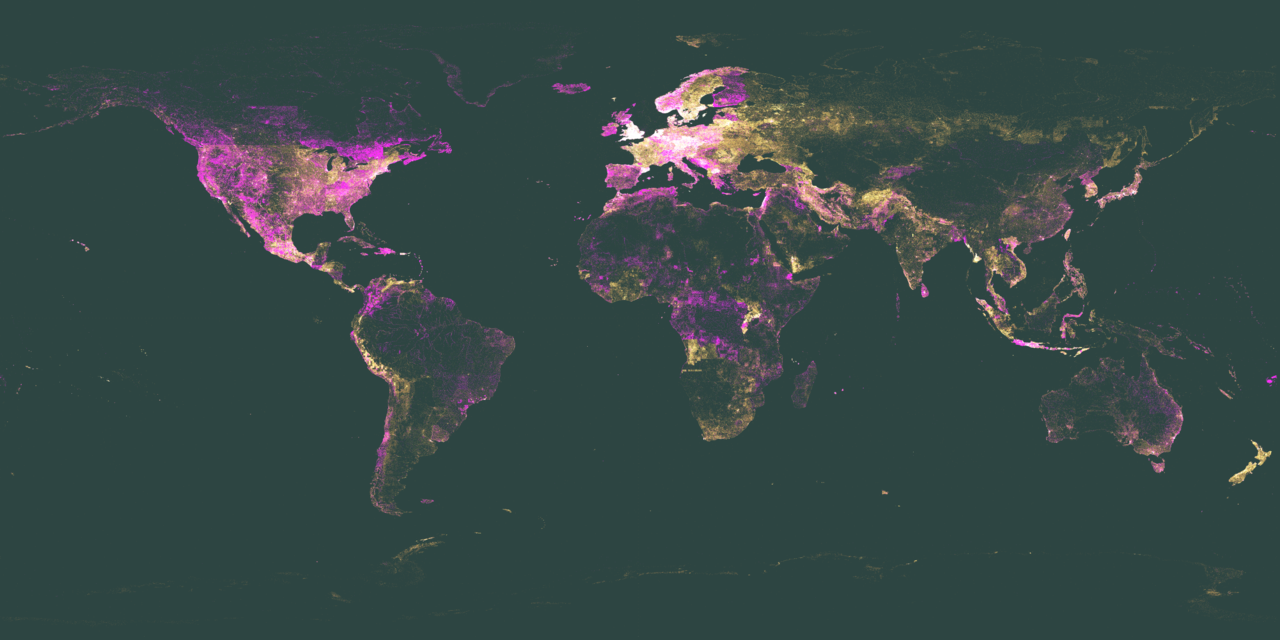
Another year, another map, and another Birthday for Wikidata. Last generated in 2024 by @tarrow and @outdooracorn, this year I have put the work in just ahead of the 13th Wikidata birthday to have a look at what’s changed in terms of items with coordinates this past year on Wikidata.

And here it is!

But really you need to look at the diff between previous years to see what has changed!

Read more

Wikidata Map in 2024

This entry is part 16 of 17 in the series Wikidata Map

Another year on from the last generation of the Wikidata map, @tarrow and @outdooracorn spent some time in preparation for the Wikidata birthday to prepare a new map (see git commits).

The latest images have already been uploaded to Wikimedia Commons, and appear in the Wikidata map commons gallery.

In this post, I’ll have a look at what has changed in the past year that is visible from the map!

Read more

Wikidata Map in 2023

This entry is part 15 of 17 in the series Wikidata Map

It’s been 2 years since the 2021 Wikidata map. Yesterday I was sitting in the WMDE office and Lydia raised the point that we hadn’t made a map in quite some time (T331124).

Maps used to try to generate in a somewhat automated fashion, but the process was rewritten in 2021 and still needs to be run by hand with someone with access to the WMF analytics platform.

Thankfully the documentation of the updates still works perfectly, and the whole process of the map generation only took a few minutes!

Read more

Wikidata Map May – November 2019

This entry is part 13 of 17 in the series Wikidata Map

It’s time for another blog post in my Wikidata map series, this time comparing the item maps that were generated on the 13th May 2019 and 11th November 2019 (roughly 6 months). I’ll again be using Resemble.js to generate a difference image highlighting changed areas in pink, and breakdown the areas that have had the greatest change throughout the 6 month period. The full comparison image can be found here.

Differences in the Wikidata map highlights in pink for changes between May 2019 and November 2019

If you don’t know what Wikidata is, or what items are then give this page a read. This map shows all items that have a “coordinate location” as a light pixel on a black canvas. The more items with coordinates in a single pixel, the brighter that pixel. This map is generated using code that can be found here.

Read more

Wikidata Map July 2019

This entry is part 12 of 17 in the series Wikidata Map

It’s been another 9 months since my last blog post covering the Wikidata generated geo location maps that I have been tending to for a few years now. Writing this from a hammock, lets see what has noticeably changed in the last 9 months using a visual diff and my pretty reasonable eyes.

Wikidata “Huge” map generated on the 13th May 2019

Read more

Wikidata Map October 2018

This entry is part 11 of 17 in the series Wikidata Map

It has been another 6 months since my last post in the Wikidata Map series. In that time Wikidata has gained 4 million items, 1 property with the globe-coordinate data type (coordinates of geographic centre) and 1 million items with coordinates [1]. Each Wikidata item with a coordinate is represented on the map with a single dim pixel. Below you can see the areas of change between this new map and the once generated in March. To see the equivalent change in the previous 4 months take a look at the previous post.

Comparison of March 26th and October 1st maps in 2018

Read more

Wikidata Map March 2018

This entry is part 10 of 17 in the series Wikidata Map

It’s time for the first 2018 installation of the Wikidata Map. It has been roughly 4 months since the last post, which compared July 2017 to November 2017. Here we will compare November 2017 to March 2018. For anyone new to this series of posts you can check back at the progression of these maps by looking at the posts on the series page.

Each Wikidata Item with a Coordinate Location(P625)will have a single pixel dot. The more Items present, the more pixel dots and the more the map will glow in that area. The pixel dots are plotted on a totally black canvas, so any land mass outline simply comes from the mass of dots. You can find the raw data for these maps and all historical maps on Wikimedia Tool Labs.

Looking at the two maps below (the more recent map being on the right) it is hard to see the differences by eye, which is why I’ll use ImageMagik to generate a comparison image. Previous comparisons have used Resemble.js.

Read more