COVID-19 Wikipedia pageview spikes, 2019-2022

Back in 2019 at the start of the COVID-19 outbreak, Wikipedia saw large spikes in page views on COVID-19 related topics while people here hunting for information.

I briefly looked at some of the spikes in March 2020 using the easy-to-use pageview tool for Wikimedia sites. But the problem with viewing the spikes through this tool is that you can only look at 10 pages at a time on a single site, when in reality you’d want to look at many pages relating to a topic, across multiple sites at once.

I wrote a notebook to do just this, submitted it for privacy review, and I am finally getting around to putting some of those moving parts and visualizations in public view.

Methodology

It certainly isn’t perfect, but the representation of spikes is much more accurate than looking at a single Wikipedia or set of hand selected pages.

  1. Find statements on Wikidata that relate to COVID-19 items
  2. Find Wikipedia site links for these items
  3. Find previous names of these pages if they have been moved
  4. Lookup pageviews for all titles in the pageview_hourly dataset
  5. Compile into a gigantic table and make some graphs using plotly

I’ll come onto the details later, but first for the…

Graphics

All graphics generally show an initial peak in the run-up to the WHO declaring an international public health emergency (12 Feb 2020), and another peak starting prior to the WHO declaring a pandemic.

Be sure to have a look at the interactive views of each diagram to really see the details.

COVID-19 related Wikimedia pageviews (interactive view)

Read more

See all Windows 11 network data usage

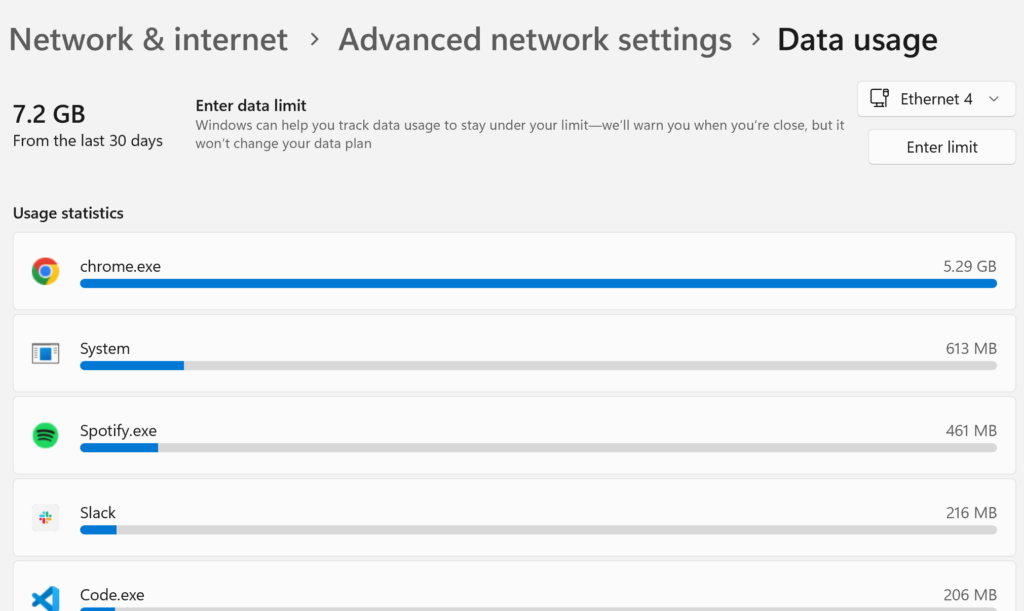
Windows 11 (and possibly previous versions of windows) have a data usage view built into the advanced network settings view.

This feature allows users to monitor and manage their data usage on both Wi-Fi and wired connections, and I assume also data connections if your device can be connected via a SIM.

The Data usage page only allows you to see the current usage of networks that you are connected to, and doesn’t allow you to get a view of the whole picture.

For example, my current “Ethernet 4” usage is 7.2GB in the last 30 days, and the current Wi-Fi network that I am on has 97.1GB usage in the last 30 days.

However, I spend lots of time on other networks, and would love to know my overall data usage in the past 30 days.

Where is the data?

I figured all of the data was stored somewhere on disk, the real questions was where.

After a fair bit of googling I came accros “SRUM” or “System Resource Usage Monitor”, and “SRUDB.dat” referenced quite a lot:

Read more

If you have a sandwich and cut it in half, do you have one or two sandwiches

A few years ago, I asked a similarly silly question about lasagne to a group of people I know and summarized their responses. This time I’m bored on a coach, so asked 30–40 people the question “If you have a sandwich and cut it in half, do you have one or two sandwiches”.

In this post, I’ll occasionally refer to individuals by 2 letter initials to keep their personal sandwich views mostly private, while still allowing for a good laugh and for them to follow the analysis.

A few people that have ended up in both lasagne and sandwich groups noticed what I was doing and started reminiscing about the lasagne topic, shout out to HD, GC & LM…

From the provided opinions, there are several distinct groupings based on the perspectives shared.

But to introduce the problem, let’s take a look at this sandwich platter I found online, and how many sandwiches people think it delivers.

Read more