For a while I have been running a Wikibase query service update script for WBStack, which is a Java application on a Kubernetes cluster. Part of that journey has included the updater using all available memory, hitting into the kubernetes memory limit and being OOM killed. The title of the post is a little verbose, but I wanted to include all of the keywords that might help people find the answers to the memory issues that I was running into.
Before getting into my weeds, if you want the answers head straight to https://developers.redhat.com/blog/2017/04/04/openjdk-and-containers/
UPDATE: This blog post was written with Java 8. Java 10+ now automatically recognizes memory limits and enforces them. https://www.docker.com/blog/improved-docker-container-integration-with-java-10/
How I ended up with a long running Java app on k8s
My initial query service updater regularly restarted the JVM, but this was slow, as restarting a JVM has some overhead. I investigated using the Facebook nailgun project but it appeared to be less supported than I would have liked. Instead I opted to rewrite the updater fully in Java meaning no more JVM restarts.
This immediately improved performance and reduced complexity from my original prototype. You can find a rough version of the code here but it is not yet merged upstream.
The memory usage problem
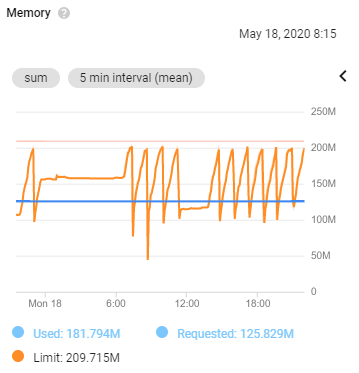
The pattern of memory usage was frankly ridiculous. The program would start using ~8MB of memory but constantly increase in usage until reaching the limit imposed by the cgroup and bring killed.
I didn’t have time to immediately solve it and the acceptable solution for now was to have the process hit into the memory limit and be killed every ~45 minutes.
Investigation
Wanting to dig into if the updater itself was using this memory, or if it was some other overhead or bad metric collection I opted to have the updater repeatedly output its consumed memory.
long memory = runtime.totalMemory() - runtime.freeMemory();
System.out.println(
	"Loop " + count + "/" + countLimit + ". " +
	"Total mem:" + (runtime.totalMemory() / (1024L * 1024L)) + ". " +
	"Free mem:" + (runtime.freeMemory() / (1024L * 1024L)) + ". " +
	"Used mem:" + (memory / (1024L * 1024L)) + ". " +
	"Max mem:" + (runtime.maxMemory() / (1024L * 1024L)) + ". "
);Code language: JavaScript (javascript)
This resulted in me figuring out that the memory allocation was being respected and that the the application wasn’t actually using a whole lot of memory.
Loop 76/250. Total mem:7. Free mem:5. Used mem:2. Max mem:38.
Loop 75/250. Total mem:7. Free mem:5. Used mem:2. Max mem:38.
Loop 74/250. Total mem:7. Free mem:5. Used mem:2. Max mem:38.
Loop 73/250. Total mem:7. Free mem:5. Used mem:2. Max mem:38.
I investigated a few more ideas to figure out what was happening, including poking some other Java runtime settings for memory usage but I didn’t manage to improve the situation.
I figured that this was probably an issue with running Java in a containerized environment, or on Kubernetes specifically, and that is when my web searches struck “gold”.
The solution
The JVM doesn’t play nice in the world of Linux containers by default, especially when it isn’t free to use all system resources, as is the case on my Kubernetes cluster.
Using -Xmx=30m for example would allow the JVM to continue well beyond this point. Now for a quote from the article that I found.
The JVM historically looked in /proc to figure out how much memory was available and then set its heap size based on that value. Unfortunately, containers like Docker don’t provide container specific information in /proc.
https://developers.redhat.com/blog/2017/04/04/openjdk-and-containers/
As a result the JVM believes it can use all available system memory and doesn’t bother doing so much garbage collection. You can see the difference below for my container where available memory is 3GB, but the cgroup limit is ~150MB (and that limit was only set so high as I was having this problem).
$ cat /proc/meminfo  | grep Mem
MemTotal:        8173316 kB
MemFree:          310844 kB
MemAvailable:    3323916 kB
$ cat /sys/fs/cgroup/memory/memory.limit_in_bytes
157286400
The writer of the redhat post goes on to say:
I’ve proposed a patch which has been accepted upstream to provide a -XX:+UseCGroupMemoryLimitForHeap command line argument which tells the JVM to look in /sys/fs/cgroup/memory/memory.limit_in_bytes to figure out how much memory is available.
https://developers.redhat.com/blog/2017/04/04/openjdk-and-containers/
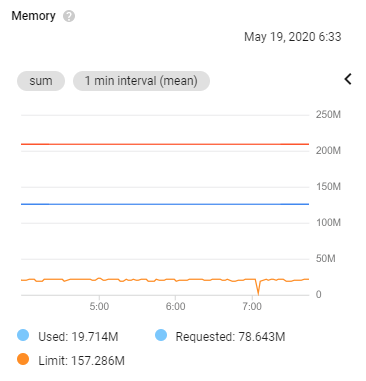
Passing these extra options to Java ended up solving my problems and have resulted in steady consistent predictable memory usage by Java on Kubernetes.
-XX:+UnlockExperimentalVMOptions -XX:+UseCGroupMemoryLimitForHeap Code language: CSS (css)I can now continue to optimize the requests and limits for the process on Kubernetes to free up memory for other application and improve stability.
Closing
I highly recommend giving the full blog post a read as it it goes into even more detail and also covers other options for optimization for a container environment such as serial garbage collection and disabled compiler optimization to reduce more heap overhead. I’m now using these options and more for my Java application.
Which version of java ?
8!
You didn’t mention what version of Docker, Java, or Kubernetes that you were running. Perhaps it was Java 8 or 9? I’d suggest to always mention software versions in your articles; it helps others later. Also, it’s probably good to do an UPDATE: on this post. Specially that Java 10+ now automatically recognizes memory limits and enforces them. Java 10+ complies with the cgroups set in a container, earlier versions of Java did not. https://www.docker.com/blog/improved-docker-container-integration-with-java-10/
Thanks for the comment!
I specified the Java version in my post now, and also added an update note talking about 10+.
As far as I can tell the k8s version shouldn’t be relevant so I have not included it.